
In this short visual guide I will show how to create a custom report from your own SQL query in Fortianalyzer. Fortianalyzer comes with plethora of datasets and reports defined - more than 800. My issue with all of them - they are overly complex and are geared more towards C-level management to impress with lots of pie charts and graphs. 5 lines of SQL query to just get CPU/memory/sessions/users connected ? In this guide I will get from Fortianalyzer CPU, memory, number of sessions and their setup rate, and bandwidth used. I needed this data to do sizing/capacity planning for existing Fortigate 500D of our client.

Create custom dataset
Any report, custom or built-in, starts with the dataset - SQL query sent to the Fortianalyzer PostGRE SQL database holding the Analytics data. Different log types (Event, Traffic etc.) are inserted into separate SQL tables. We can specify the table name explicitly or use generic $log and set the table via drop down menu.
To create a dataset, go to Reports → Report Definitions → Datasets.
Here is the dataset I created to get the data I needed (legend and explanations below):
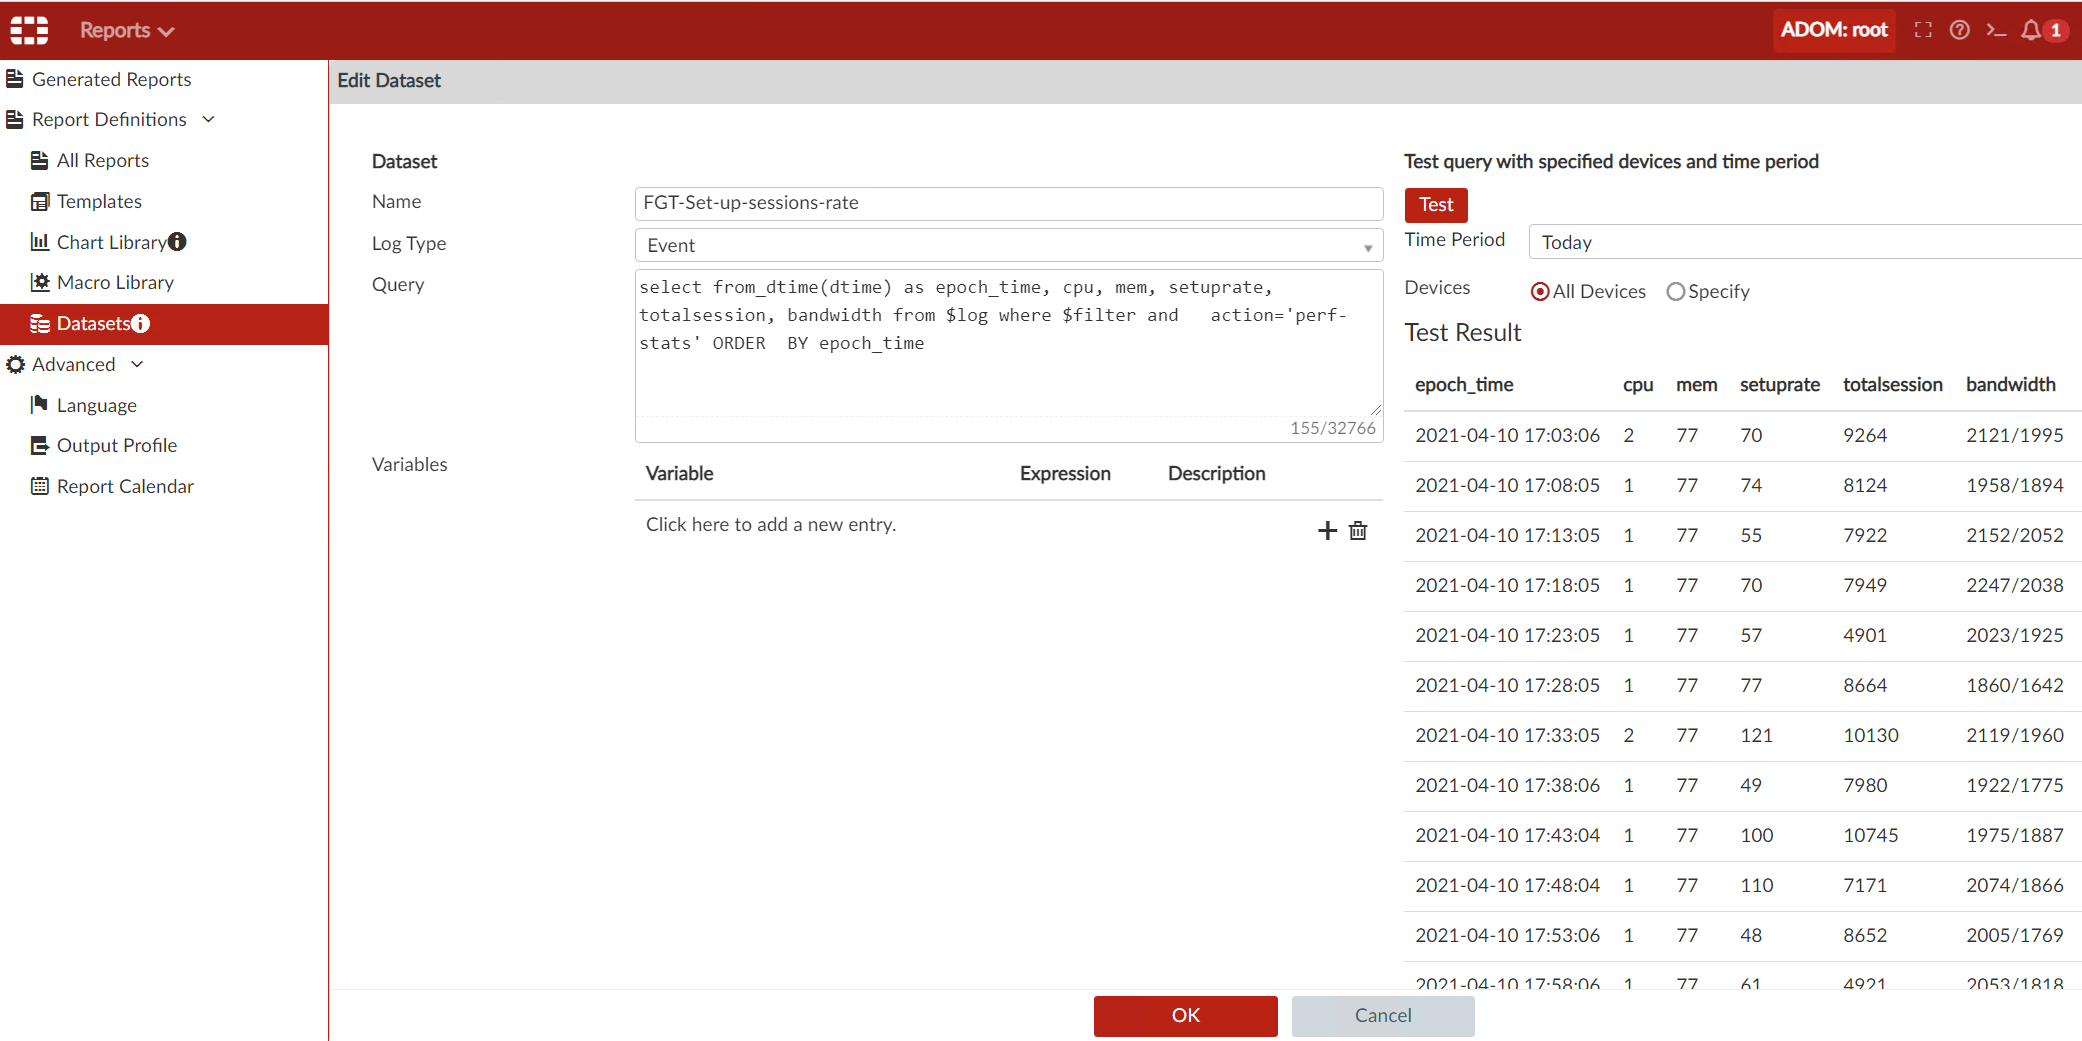
Name Any name to make it easy to find.
Log Type SQL table to query. You can either explicitly state the log name (see table below for the whole list) or leave it to Fortianalyzer. Here I am using Event as this type of log (and accordingly its SQL table) contains performance data I need.
Query: select from_dtime(dtime) as epoch_time, cpu, mem, setuprate, totalsession, bandwidth from $log where $filter and action='perf-stats' ORDER by epoch_time
- from_dtime(dtime) dtime is timestamp of the log on the device (Fortigate) in epoch format, and from_dtime is a utility function to translate this timestamp from epoch to human-readable format.
- cpu, mem, setuprate, totalsession, bandwidth are column names in the table I want to get values of.
- from $log: as I set in drop down menu above log type to the Event, this will auto-choose correct the SQL table.
- where $filter and action='perf-stats' is a combined filter, $filter is a place holder for Time Period (Today) and Devices (All), which Fortianalyzer obliges you to set. Set the time period to how far back in time you need this data. And action='perf-stats' is my search filter on action column in the table/log, to return only those logs from Events, that have action column set to perf-stats.
- ORDER BY epoch_time order the result set by logs timestamps, as by default results are returned in random order otherwise. I use capital here to show that for Fortianalyzer the case of SQL query does not matter.
Next step is to click on Test and verify that results are what you expect. This testing returns about 100 lines only, but no worries - in actual report it will return all records it finds.
Create a chart using the dataset
Now I can use this custom dataset to create a chart Report Definitions → Chart Library → New ... I choose Table as chart type, the alternative being pie and other graphics. As I need to get ALL CPU/memory measurements over time, only table will suit.
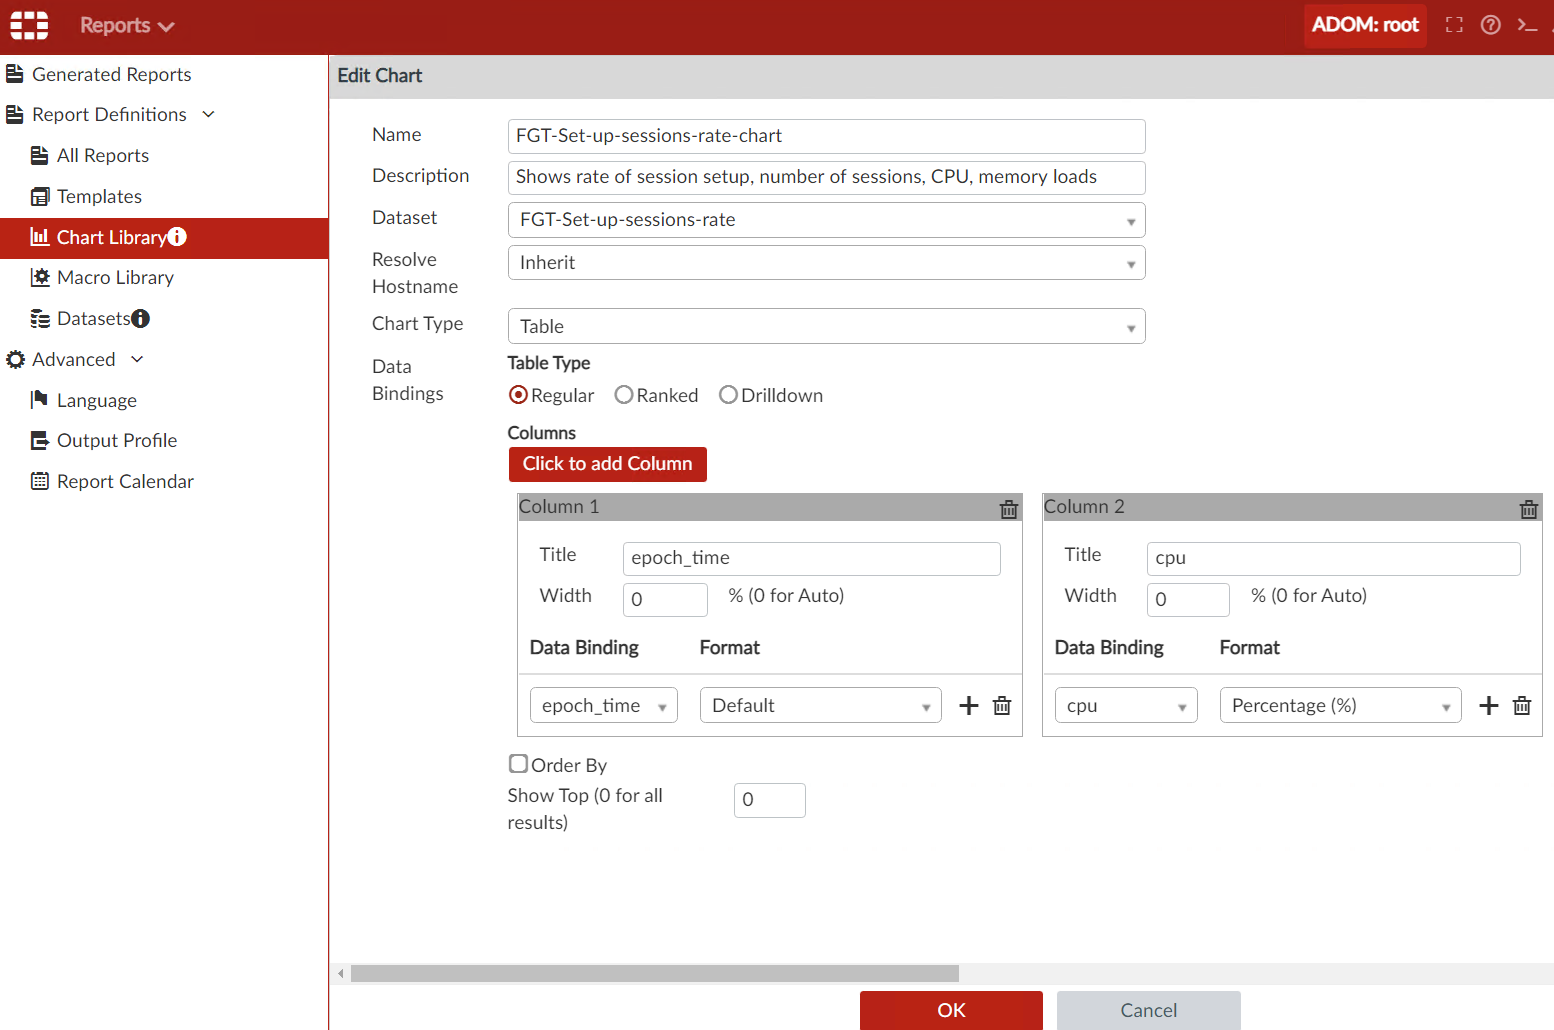
| Name | Any unique name to find it later. |
| Description | Well, description. |
| Dataset | Here I choose the custom dataset I created earlier. |
| Resolve Hostname | Leave it as is. |
| Chart Type | Table |
| Data Binding | Regular |
| Columns | These were auto-added based on the dataset I chose, no need to change anything. |
| Show Top | This is important - by default it is set to 100 and so the result table would include first 100 rows only! Not what I need, so I set it to 0 to return ALL results. |
Click OK and let’s move to the next step - creating the report.
Create the Custom Report Using the Chart Created Above
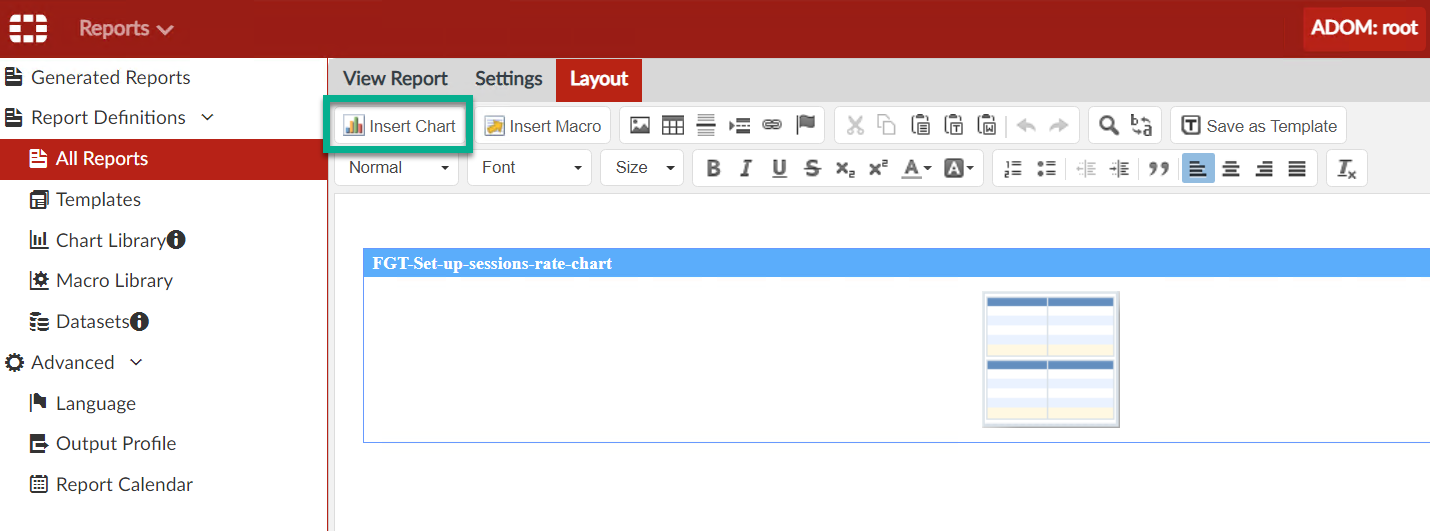
In Reports → Report Definitions → All Reports → New .. I create a new blank report
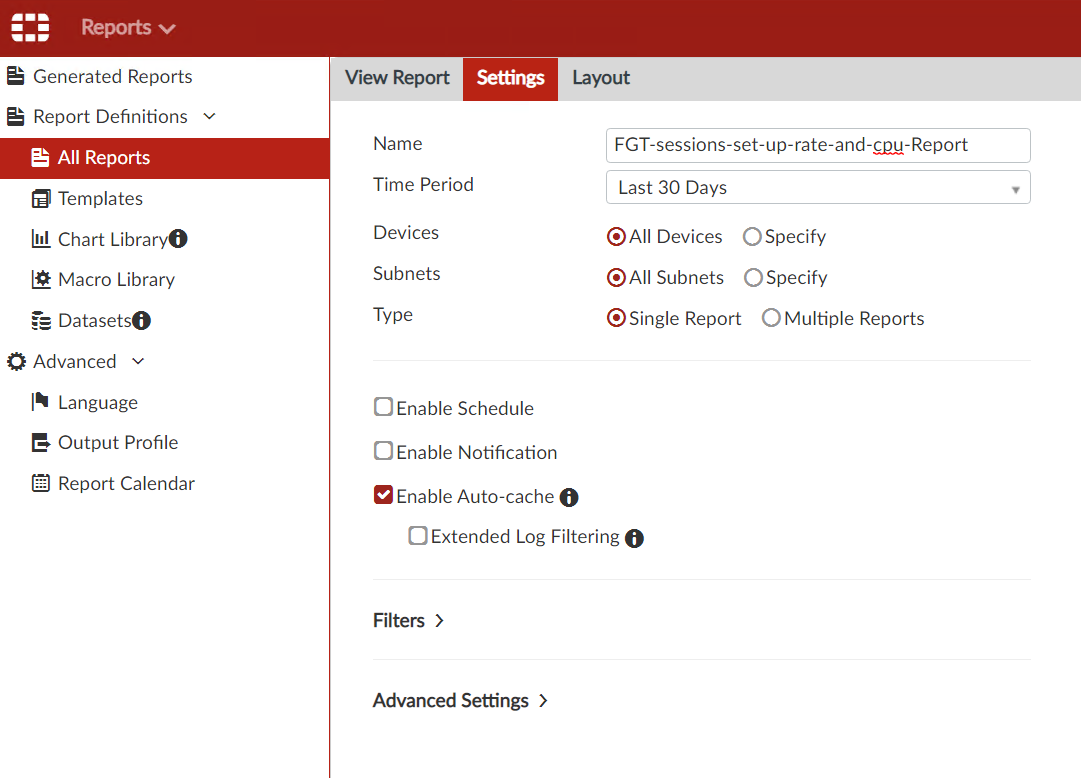
In the Layout tab I click on Insert Chart and pick the chart I created above. In Settings tab we can limit the returned data by device and by time. This is the second place it is possible to do - first one is when creating dataset. If Fortianalyzer has data for less than specified period, it will not complain nor warn us in any way.
Click on OK and it’s done - the new custom report is available to run.
Run the Custom Report and Download Result
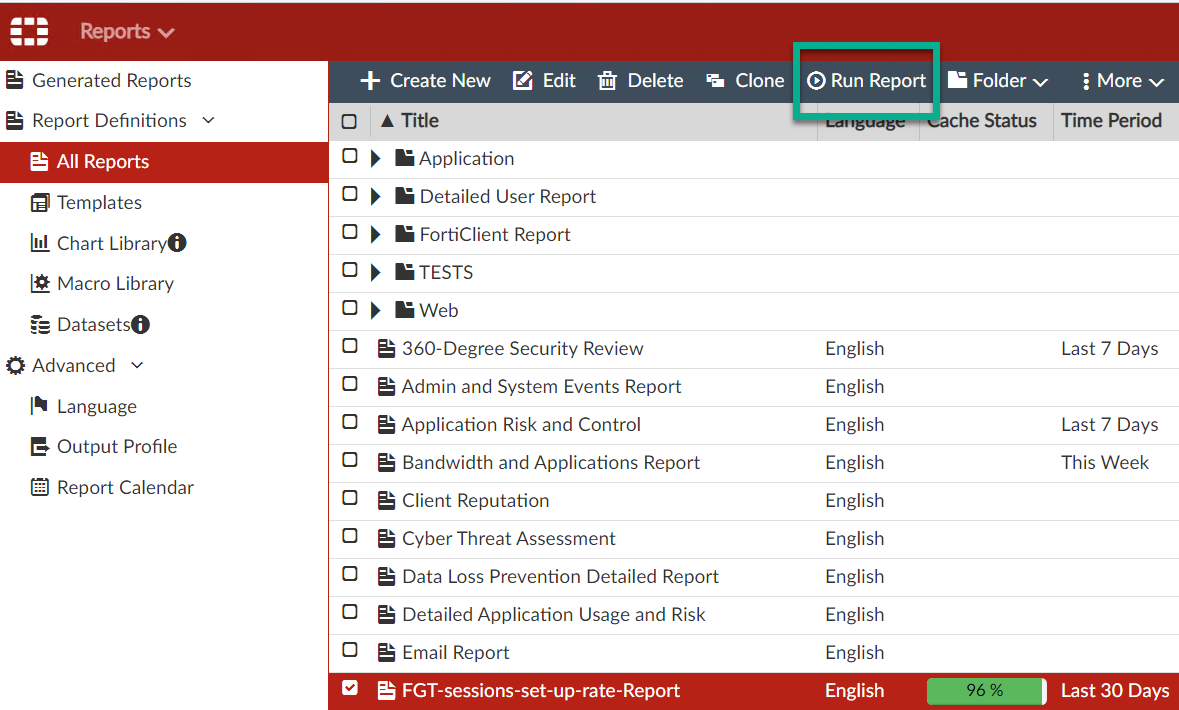
What is left is to go to Reports → Report Definitions → All Reports, find the report I created, select it, and click Run.
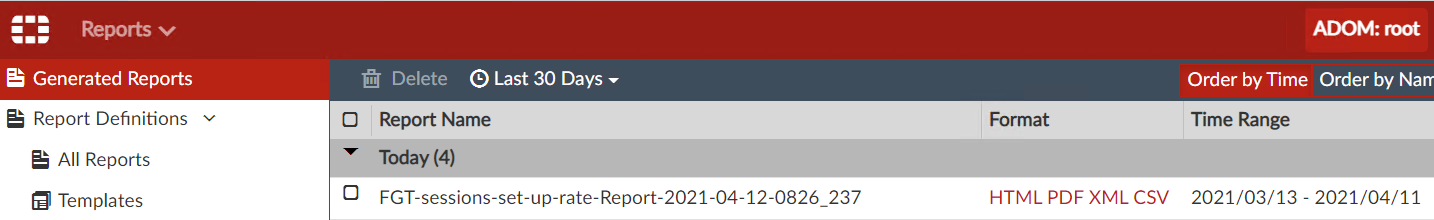
When finished running, there are results available for download as XML, PDF, HTML, CSV in Generated Reports.
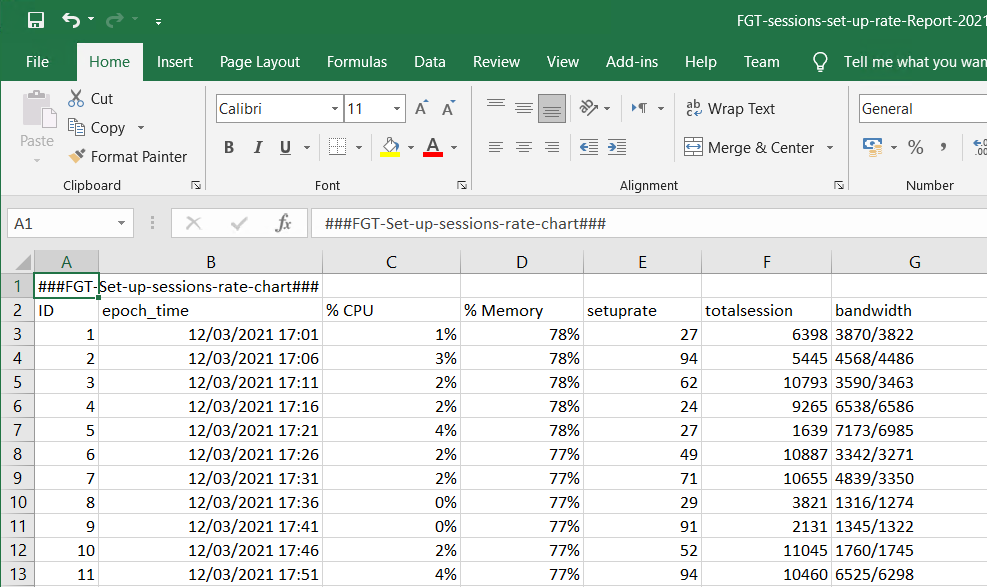
Here is how this report looks in Excel after downloading it as CSV file:
| Log type | Log name to use in SQL query |
|---|---|
| Traffic log |
| Event log |
| Attack log |
| AppControl log |
| Antivirus log |
| Web filter log |
| DLP log |
| Antispam log |
| Netscan log |
Follow me on https://www.linkedin.com/in/yurislobodyanyuk/ not to miss what I publish on Linkedin, Github, blog, and more.
