
Published on June 1, 2025 11:48 AM GMT
This is a crosspost of a post from my blog, Metal Ivy. The original is here: An Opinionated Guide to Statistical Significance.
I think for the general audience the value of this post is the first half, which tries to give a practical intuition for p-values.
But for LessWrong the value is probably the mathematical second half, which breaks down p-values using Bayes' Law and tries to invert it into an updated belief. That is since most people on LessWrong are probably already familiar with the XKCD jelly bean example. Feel free to skip there, to the heading "Is there really no way to invert p-value into something we want?".
Different fields of science have different levels of accessibility for laymen, and different fields of science receive different amounts of interest from laymen. Medicine is unique in that it’s basically normal to read primary clinical studies yourself. Ok, maybe it’s not actually normal, but it’s common enough in this part of the internet.
This is because medical studies relate to decisions that are of high importance to most people, and are free from the mathematical wall that stops people from freely reading a paper in most other fields.
Further, medicine is very broad, and you likely only care about a very specific corner of it. If you read a bunch of studies about some esoteric medication you’re taking or condition you have, there rapidly become decent odds you’ve read more about it than your doctor, at least where recent studies are concerned.
The single most important concept to understand when evaluating medical papers is the concept of statistical significance. Specifically, since you care about the results of the study, you probably jump to the results. And almost universally the results are described as something like the following:
“For the subgroup with condition, the intervention was statistically significantly superior to placebo at 8 weeks.”
Bolded are the words that I would label jargon, i.e. a random educated person wouldn’t understand. But assuming you arrived at this study because you are interested in taking intervention for condition, you probably already understand what those two mean, or can infer. But I think most people see “statistically significant” and barely even recognize it to be jargon: it sounds positive, so it must mean that the intervention is superior to placebo.
This same terminology is used in many other fields as well, and is defined in terms of P-values, which are used literally everywhere.
A practical intuition:
Statistical significance, which is different from “clinical significance” or any intuitive concept of “significance” is a very low bar. What statistical significance means in probabilistic terms, is
That’s the definition. In words, it means that if the hypothesis was wrong, the chance you would get a P-value < 0.05, which is what people mean when they say statistical significance, is less than 5%. The thing you care about, mind you, is the chance the hypothesis is wrong, given that you got a statistically significant result. That’s the reverse (to save space, I’m going to write h instead of hypothesis):
Studies that check peoples’ (e.g. doctors’) understandings of statistical significance, and P-value, show they often think those two are the same. I believe this probably happens because they notice that they are always provided with the first, and they care about the second, but they are similar, so maybe we can just invert them? Maybe it’s true that P(A|B) = P(B|A)? Like 32 = 23. Maybe the chance that A is true given B is the same as B being true given A.
But this is unfortunately wrong. The fact is that statistical significance, and P-value, are not what you care about. It’s just that what you do care about is very hard (or arguably impossible) to objectively calculate. They are related by Bayes’ Law, which I will get into later for people who want to go more in depth. But P-values are the best we have, so that’s what we calculate. In many ways it’s a very useful and elegant statistic. But what you care about is P(A|B), and instead you get P(B|A).
The most rigorous way to get what we want from what we have is to look at it empirically, that is, take a bunch of studies that got statistically significant results, try to replicate them, and see how many fail to replicate. As far as I know, such a proper empirical examination was done twice, once in 2015 for psychology, and another time in 2021 for cancer biology. They give us these empirical numbers:
In psychology,
and in cancer biology,
You read that right: if a peer reviewed study in psychology or cancer biology, and by extension likely most of science, claims that some effect was detected with statistical significance, the chance future high powered replication attempts will also detect that effect (which is what I’m from now on going to describe as the hypothesis being “correct”) is less than 50%.
One can make the inference that the situation is better for newer studies, as well as preregistered studies such as preregistered clinical trials (which a tiny fraction of studies are), which I will make an argument for later. Regardless, we don’t have better numbers than these. The most correct, immediate, general inference when you see a random study claim statistical significance, is that there is about a 40% chance that the result is real, as opposed to a statistical fluke. This probability is an approximation, but it’s much more accurate than the 95% number, which most people seem to believe.
This isn’t nothing! Before you’ve seen any study at all, the odds are a lot lower. If someone says: hmm I wonder if drug X could help people with condition Y? And nobody tested it yet, or worse, tested and did not get statistical significance, the chance that it is true is a lot closer to 0% than 40%. Most hypotheses are wrong!
If you want to go a step further and extract more information, most studies, while reporting primarily “statistical significance”, will also mention the precise P-value. Statistical significance means the P-value is lower than 0.05, but it might be even lower than that. The same psychology investigation above concluded that
This 0.001 bar is sometimes called “very statistically significant”, but usually the number is simply written and rightfully enthused about.
That means if you see a P < 0.001, that actually means the hypothesis is more likely to be true than false! All it takes is a bar 50 times more strict than what most papers call “statistically significant”.
But why is statistical significance such a low bar, intuitively?
As mentioned above, almost always when you see “statistical significance”, in medicine or psychology, it means that the P-value is lower than 0.05, with regards to some statement, such as “this drug is better than placebo”. And what that means, is simply “Had this statement been false, the chance we would have come to the conclusion we are coming to now is less than 5%”. So for instance, if the study checked the correctness of 20 different false statements, it will on average conclude that one of them is actually statistically significant.
Notably, this means that if less than 5% of tested hypotheses are actually true, the majority of statistically significant results would be false, as we saw is actually the case in the empirical numbers above. An example of how this would happen is illustrated in the xkcd comic below, about jelly beans and acne:
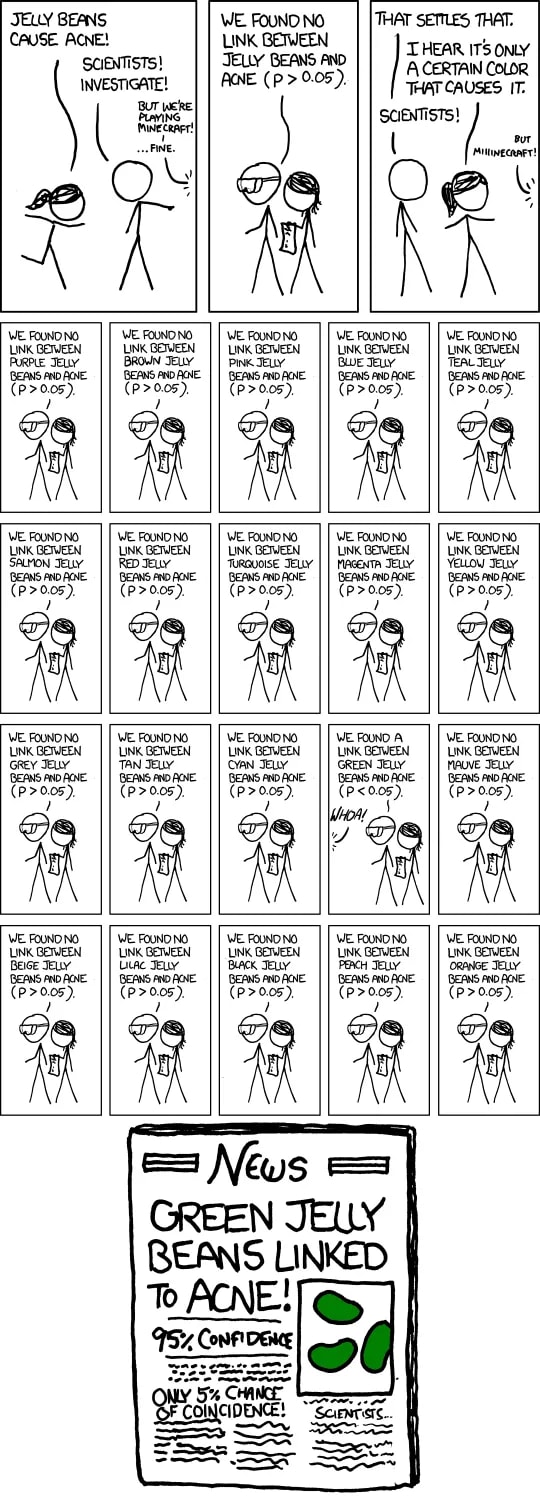
That is: often when testing some sensible hypothesis, like “Jelly beans cause acne”, you can easily divide it into 20+ subhypotheses, such as “Green jelly beans cause acne”, “Purple jelly beans cause acne”, et cetera. By chance one of these 20 will likely achieve statistical significance.
If this seems contrived, consider that “Jelly beans cause acne” is itself a subhypothesis of “some types of candy cause acne” which is itself a subhypothesis of “there is some causal connection between food and acne”. There are many more than 20 perfectly sensible subhypotheses for “there is a causal connection between food and acne”.
Even worse, compounding this issue, is, as again illustrated by the comic, only the positive result tends to be published — what’s called publication bias. If you would have read all 20 jelly bean experimental reports, what happened here would likely be obvious. But you aren’t likely to see those — you will see the article that shows green jelly beans have a statistically significant effect on acne, and it alone, because it is the only one anyone wants to publish.
Is there really no way to invert P-value into something we want?
Suppose you really want to invert P-value into the value we care about (an understandable desire!). You need to make some serious assumptions, and this section mostly discusses why they are necessary, and when they can actually be tractable.
Now, this is the math part, we are going to be using Bayes’ Law. I really tried to minimize the number of equations, an objective perspective is that I failed. For context, Bayes’ Law says that, given we want to know the odds of A being true given B being true, or P(A|B), we can calculate it as follows:
And we are interested in:
So, using the definition of statistical significance,
Note that “P < 0.05” is actually P-value < 0.05. If there is anything truly terrible about P-values, it is the notation associated with it, sorry. Also, you could replace 0.05 with any other number, if you want to talk about the specific P-value in the paper you are thinking about, instead of the general bar of statistical significance.
So the nice thing about P-value, is that the first term in the numerator should immediately be given to us. This is what P-value is for, after all, and how it is defined.
Problem is, while my derivation seems reasonable, in reality we are not dealing with:
But are dealing with:
Which is very different, since now we need to take publication bias into account. That is, the tendency of experiments with positive results being seen by you, and null results to vanish. In most cases we are stuck here.
A convenient exception is preregistered experiments — experiments that were reported (say, on https://clinicaltrials.gov/), in advance, before they were performed. The results are committed to be released, whatever they are. If that’s the case we are back to the simpler case and can continue a bit further, without needing to estimate publication bias. Using the definition of P-value, we get:
Now you need P(hypothesis is wrong) and P(P < 0.05), and this is where the trouble comes in trying to reverse the P-value into the chance the hypothesis is wrong even in the preregistered case. But we can actually go a bit further.
As a last step, if the study is well designed (e.g. large enough sample size to detect the effect), we can assume:
Which finally gives us…
What is P(hypothesis is wrong)? It’s the probability that the hypothesis was wrong, without taking into account the P-value. Do you know what it is? Can you estimate? It depends on the hypothesis, and different people will disagree on which are plausible and which are not. As is seen in the case of parapsychology, sometimes by 10 orders of magnitude.
What are the odds for telepathy to be real? Some people claim they can do it, and some of them also believe it. They will say it is 1, or P(hypothesis is wrong) = 0. Some people are pretty confident it’s impossible, but are willing to believe it might be possible, maybe 0.01. And some people will say there is a 1 in a million chance telepathy is real, or less.
You can transform our formula into a more general form,
But for very low P-values you need different assumptions, and this formula stops holding. If it gets too low the assumption that the study has sufficient statistical power to detect the P-value usually breaks down. And in fact even if it doesn’t, if the P-value that’s reported is 0.00001, the probability that dominates is not the chance of a statistical fluke, but of a miscalculation or a procedural error, since you can be confident miscalculations happen more than 0.001% of the time.
So a decent rule of thumb is that below some small P-value (maybe as high as 1 in 1000, or 0.001) you should probably just round it up.
Still, this is a nice equation. It means that if you have no publication bias (which includes bias in which papers you choose to read), and you are confident the study itself is well designed, well analyzed, and honestly reported, you can in fact convert the P-value and your original belief in the hypothesis being correct into what’s called a posterior, or updated, belief that it is correct.
For instance, in this preregistered + good study (sufficient power) case, if you got a P-value of 0.05, and your initial belief in the hypothesis was 20%, seeing the P-value should increase your confidence to about 83%. P-values are useful! You just need to make sure the underlying study is good, that there is no publication bias, and that your initial confidence in the hypothesis makes sense. Otherwise, my opinionated opinion is that sticking to the empirical numbers is our best bet. And we need more large scale replications to get better numbers.
Discuss
