
ACI.dev: The Only MCP Server Your AI Agents Need (Sponsored)

ACI.dev’s Unified MCP Server provides every API your AI agents will need through just one MCP server and two functions. One connection unlocks 600+ integrations with built-in multi-tenant auth and natural-language permission scopes.
Plug & Play – Framework-agnostic, works with any architecture.
Secure – Tenant isolation for your agent’s end users.
Smart – Dynamic intent search finds the right function for each task.
Reliable – Sub-API permission boundaries to improve agent reliability.
Fully Open Source – Backend, dev portal, library, MCP server implementation.
Skip months of infra plumbing; ship the agent features that matter.
Disclaimer: The details in this post have been derived from the articles written by the Canva engineering team. All credit for the technical details goes to the Canva Engineering Team. The links to the original articles and videos are present in the references section at the end of the post. We’ve attempted to analyze the details and provide our input about them. If you find any inaccuracies or omissions, please leave a comment, and we will do our best to fix them.
Every product team wants data. Not just numbers, but sharp, trustworthy, real-time answers to questions like: Did this new feature improve engagement? Are users abandoning the funnel? What’s trending right now?
However, collecting meaningful analytics at scale is less about dashboards and more about plumbing.
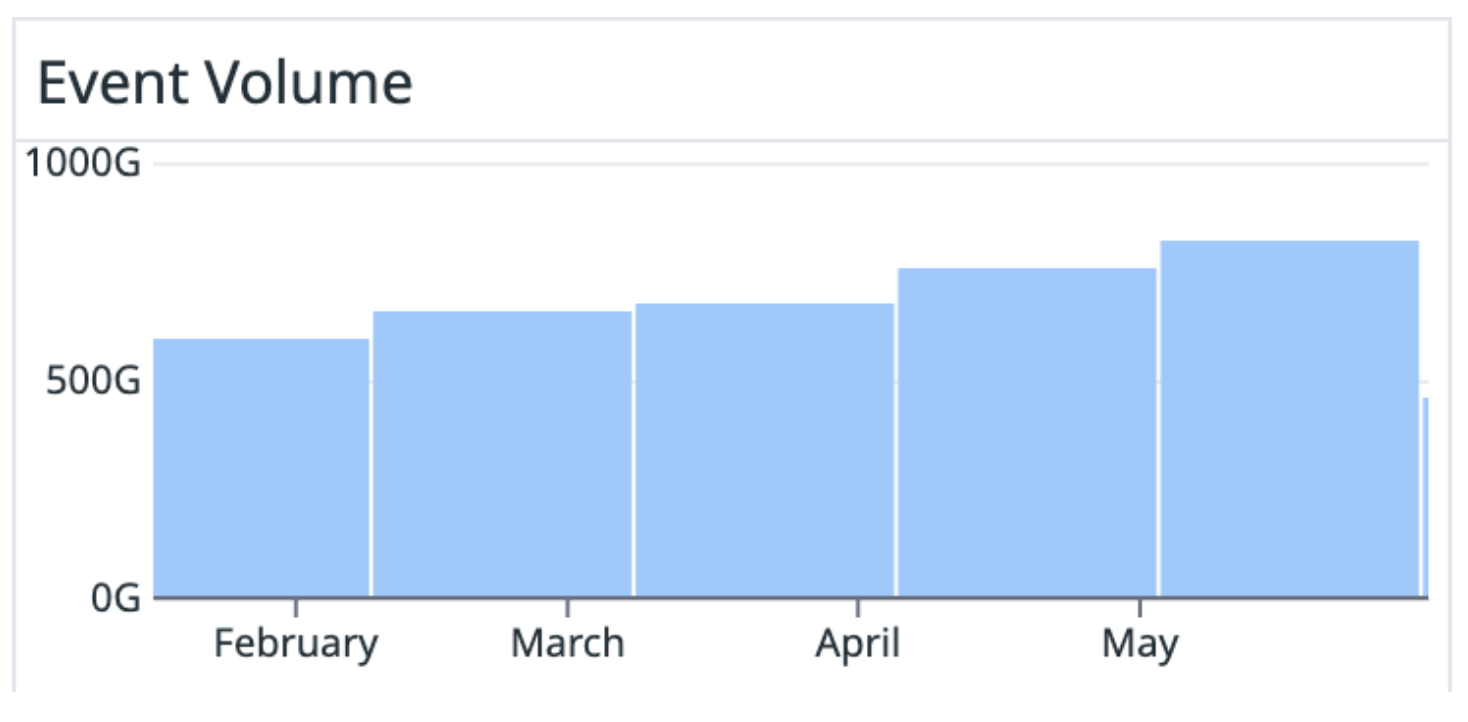
At Canva, analytics isn’t just a tool for dashboards but a part of the core infrastructure. Every design viewed, button clicked, or page loaded gets translated into an event. Multiply that across hundreds of features and millions of users, and it becomes a firehose: 25 billion events every day, flowing with five nines of uptime.
Achieving that kind of scale requires deliberate design choices: strict schema governance, batch compression, fallback queues, and a router architecture that separates ingestion from delivery.
This article walks through how Canva structures, collects, and distributes billions of events daily, without drowning in tech debt and increasing cloud bills.
Their system is organized into three core stages:
Structure: Define strict schemas
Collect: Ingest and enrich events
Distribute: Route events to appropriate destinations
Let’s each look at each stage in detail.
Structure
Most analytics pipelines start with implementation speed in mind, resulting in undocumented types and incompatible formats. It works until someone asks why this metric dropped, and there is no satisfactory answer.
Canva avoided that trap by locking down its analytics schema from day one. Every event, from a page view to a template click, flows through a strictly defined Protobuf schema.
Instead of treating schemas as an afterthought, Canva treats them like long-term contracts. Every analytics event must conform to a Protobuf schema that guarantees full transitive compatibility:
Forward-compatible: New consumers must handle events created by old clients.
Backward-compatible: Old consumers must handle events from new clients.
Breaking changes like removing a required field or changing types aren’t allowed. If something needs to change fundamentally, engineers ship an entirely new schema version. This keeps years of historical data accessible and analytics queries future-proof.
To enforce these schema rules automatically, Canva built Datumgen: a layer on top of protoc that goes beyond standard code generation.
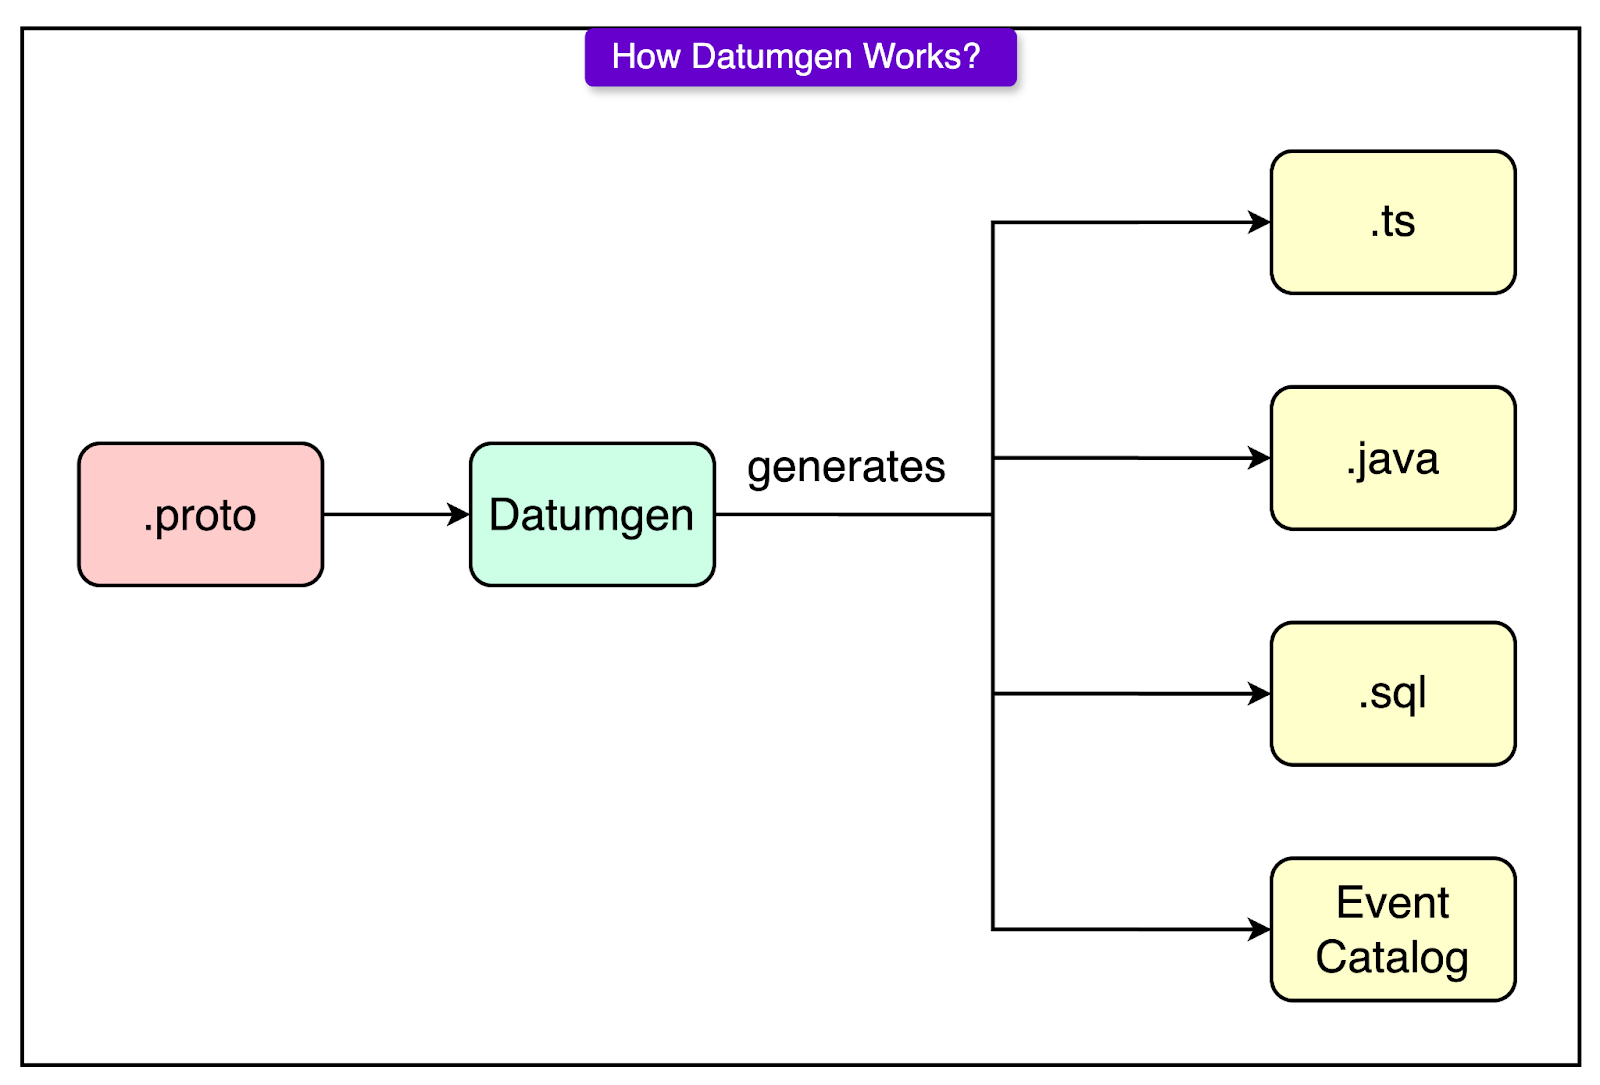
Datumgen handles various components like:
TypeScript definitions for frontends, ensuring events are type-checked at compile time.
Java definitions for backend services that produce or consume analytics.
SQL schemas for Snowflake, so the data warehouse always knows the shape of incoming data.
A live Event Catalog UI that anyone at Canva can browse to see what events exist, what fields they contain, and where they’re routed.
Every event schema must list two human owners:
A Technical Owner: Usually the engineer who wrote the event logic.
A Business Owner: Often a data scientist who knows how the event maps to product behavior.
Fields must also include clear, human-written comments that explain what they mean and why they matter. These aren’t just helpful for teammates. They directly power the documentation shown in Snowflake and the Event Catalog.
Collect
The biggest challenge with analytics pipelines isn’t collecting one event, but collecting billions, across browsers, devices, and flaky networks, without turning the ingestion service into a bottleneck or a brittle mess of platform-specific hacks.
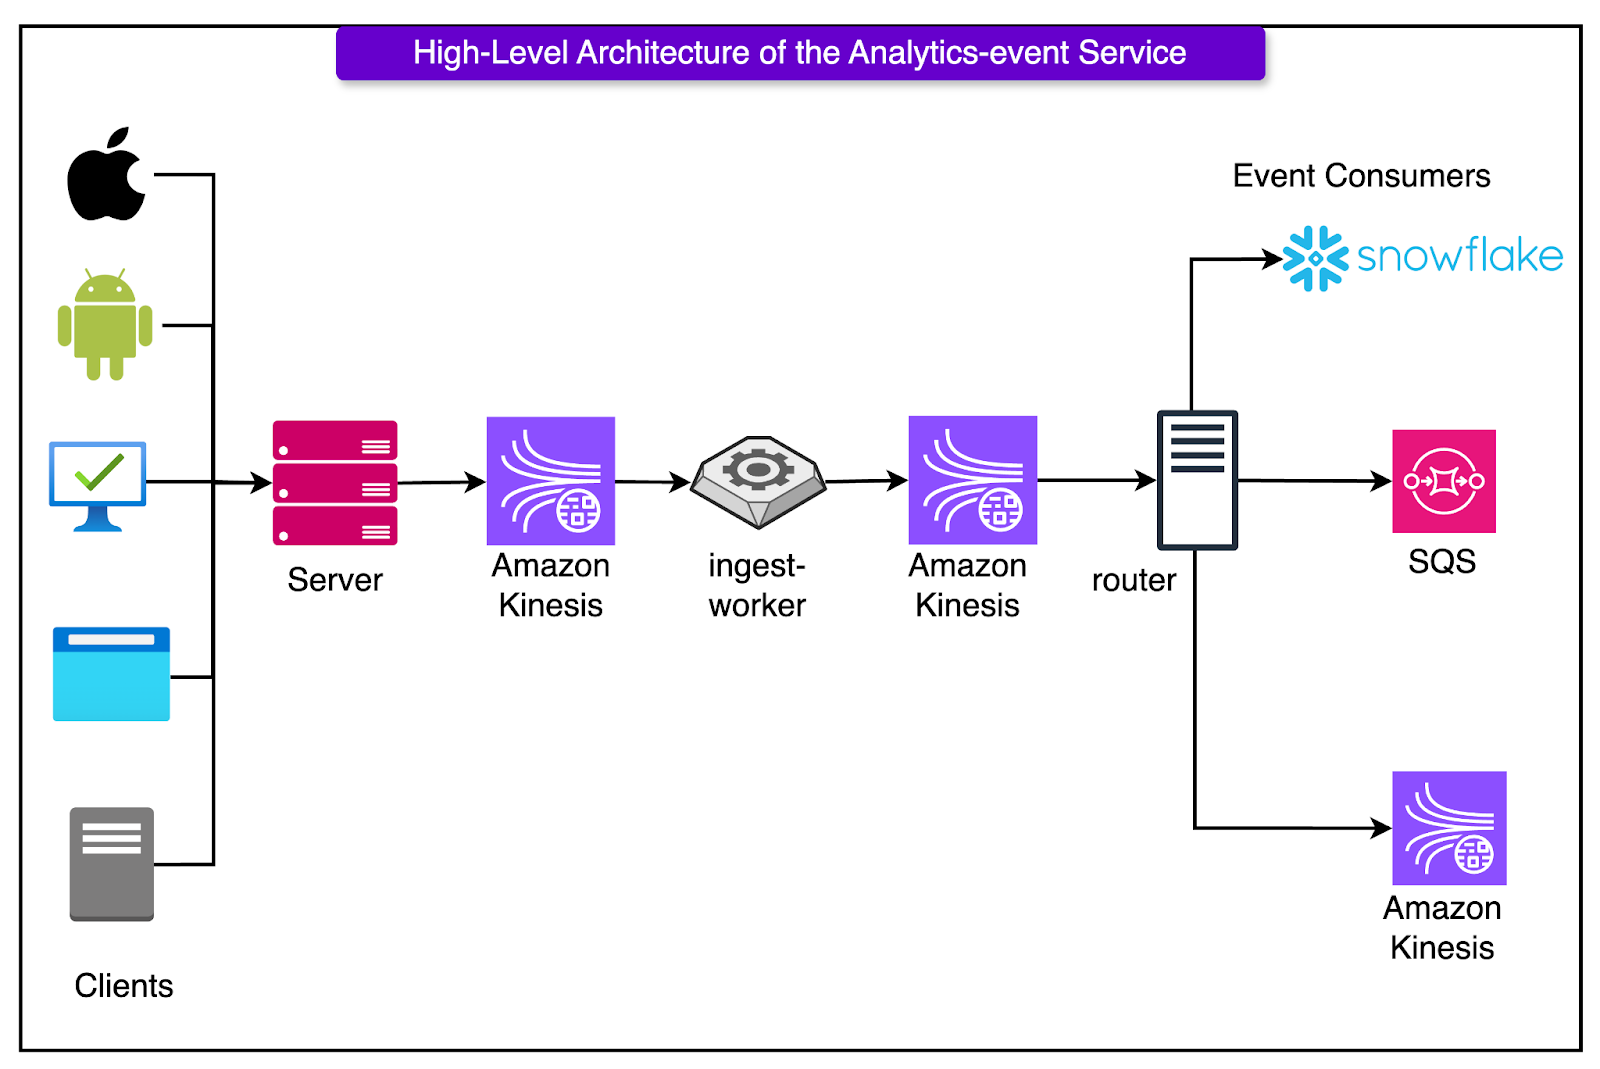
Canva’s ingestion layer solves this by betting on two things: a unified client and an asynchronous, AWS Kinesis-backed enrichment pipeline. Rather than building (and maintaining) separate analytics SDKs for iOS, Android, and web, Canva went the other way: every frontend platform uses the same TypeScript analytics client, running inside a WebView shell.
Only a thin native layer is used to grab platform-specific metadata like device type or OS version. Everything else, from event structure to queueing to retries, is handled in one shared codebase.
This pays off in a few key ways:
Engineers don’t have to fix bugs in three places.
Schema definitions stay consistent across platforms.
Feature instrumentation stays unified, reducing duplication and drift.
Once events leave the client, they land at a central ingestion endpoint.
Before anything else happens, each event is checked against the expected schema. If it doesn’t match (for example, if a field is missing, malformed, or just plain wrong) it’s dropped immediately. This upfront validation acts as a firewall against bad data.
Valid events are then pushed asynchronously into Amazon Kinesis Data Streams (KDS), which acts as the ingestion buffer for the rest of the pipeline.
The key move here is the decoupling: the ingestion endpoint doesn’t block on enrichment or downstream delivery. It validates fast, queues fast, and moves on. That keeps response times low and isolates ingest latency from downstream complexity.
The Ingest Worker pulls events from the initial KDS stream and handles all the heavy lifting that the client can’t or shouldn’t do, such as:
Geolocation enrichment based on IP.
Device fingerprinting from available metadata.
Timestamp correction to fix clock drift or stale client buffers.
Once events are enriched, they’re forwarded to a second KDS stream that acts as the handoff to the routing and distribution layer.
This staging model brings two major benefits:
It keeps enrichment logic separate from the ingestion path, preventing slow lookups or third-party calls from impacting front-end latencies.
It isolates faults. If enrichment fails or lags, it doesn’t block new events from entering the pipeline.
Deliver
A common failure mode in analytics pipelines isn’t losing data but delivering it too slowly. When personalization engines lag, dashboards go blank, or real-time triggers stall, it usually traces back to one culprit: tight coupling between ingestion and delivery.
Canva avoids this trap by splitting the pipeline cleanly. Once events are enriched, they flow into a decoupled router service.
The router service sits between enrichment and consumption. Its job is simple in theory but crucial in practice: get each event to the right place, without letting any consumer slow down the others.
Here’s how it works:
Pulls enriched events from the second Kinesis Data Stream (KDS).
Matches each event against the routing configuration defined in code.
Delivers each event to the set of downstream consumers that subscribe to its type.
Why decouple routing from the ingest worker? Because coupling them would mean:
A slow consumer blocks all others.
A schema mismatch in one system causes cascading retries.
Scaling becomes painful, especially when some consumers want real-time delivery and others batch once an hour.
Canva delivers analytics events to a few key destinations, each optimized for a different use case:
Snowflake (via Snowpipe Streaming): This is where dashboards, metrics, and A/B test results come from. Latency isn’t critical. Freshness within a few minutes is enough. However, reliability and schema stability matter deeply.
Kinesis: Used for real-time backend systems related to personalization, recommendations, or usage tracking services. Kinesis shines here because it supports high-throughput parallel reads, stateful stream processing, and replay.
SQS Queues: Ideal for services that only care about a handful of event types. SQS is low-maintenance and simple to integrate with.
This multi-destination setup lets each consumer pick the trade-off it cares about: speed, volume, simplicity, or cost.
The platform guarantees “at-least-once” delivery. In other words, an event may be delivered more than once, but never silently dropped. That means each consumer is responsible for deduplication, whether by using idempotent writes, event IDs, or windowing logic.
This trade-off favors durability over purity. In large-scale systems, it’s cheaper and safer to over-deliver than to risk permanent data loss due to transient failures.
Infrastructure Cost Optimization
Here’s how the team brought infrastructure costs down by over 20x, without sacrificing reliability or velocity.
SQS + SNS
The MVP version of Canva’s event delivery pipeline leaned on AWS SQS and SNS:
Easy to set up.
Scaled automatically.
Integrated smoothly with existing services.
But convenience came at a cost. Over time, SQS and SNS accounted for 80% of the platform’s operating expenses.
That kicked off a debate between streaming solutions:
Amazon MSK (Managed Kafka) offered a 40% cost reduction but came with significant operational overhead: brokers, partitions, storage tuning, and JVM babysitting.
Kinesis Data Streams (KDS) wasn’t the fastest, but it won on simplicity, scalability, and price.
The numbers made the decision easy: KDS delivered an 85% cost reduction compared to the SQS/SNS stack, with only a modest latency penalty (10–20ms increase). The team made the switch and cut costs by a factor of 20.
Compress First: Then Ship
Kinesis charges by volume, not message count. That makes compression a prime lever for cost savings. Instead of firing events one by one, Canva performs some key optimizations such as:
Batch collecting hundreds of events at a time.
Compressing them using ZSTD: a fast, high-ratio compression algorithm.
Pushing compressed blobs into KDS.
This tiny shift delivered a big impact. Some stats are as follows:
10x compression ratio on typical analytics data (which tends to be repetitive).
~100ms compression/decompression overhead per batch: a rounding error in stream processing.
$600,000 in annual savings, with no visible trade-off in speed or accuracy.
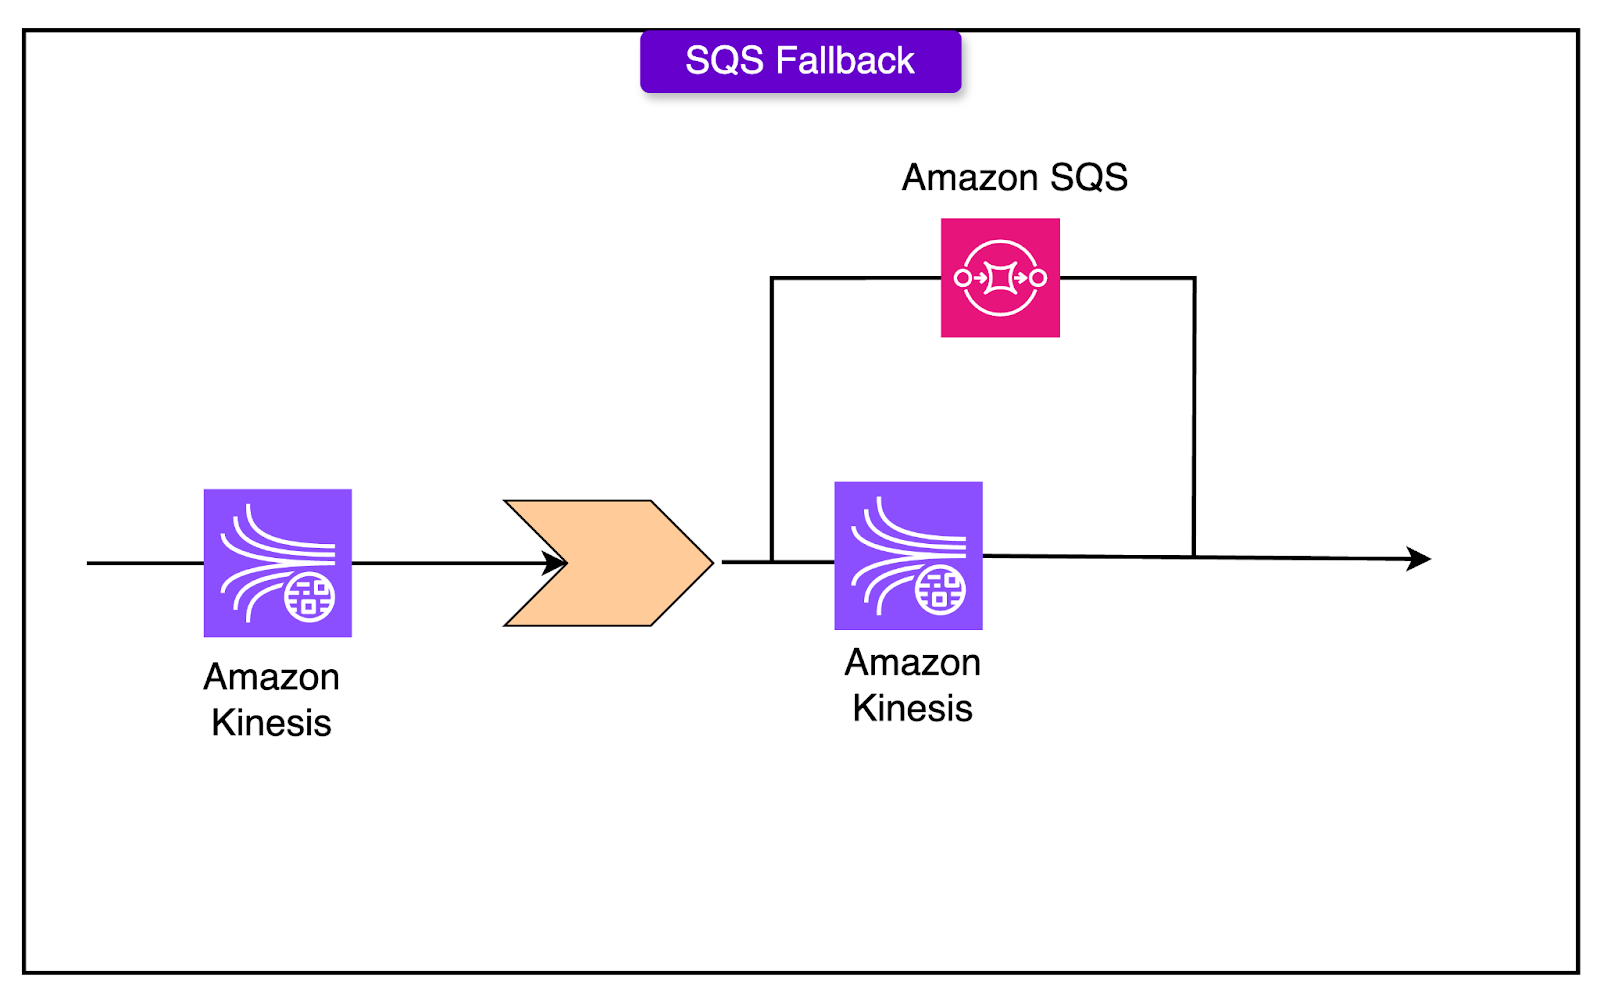
KDS Tail Latency
Kinesis isn’t perfect. While average latency stays around 7ms, tail latency can spike over 500ms, especially when shards approach their 1MB/sec write limits.
This poses a threat to frontend response times. Waiting on KDS means users wait too. That’s a no-go.
The fix was A fallback to SQS whenever KDS misbehaves:
If a write is throttled or delayed, the ingestion service writes to SQS instead.
This keeps p99 response times under 20ms, even under shard pressure.
It costs less than $100/month to maintain this overflow buffer.
This fallback also acts as a disaster recovery mechanism. If KDS ever suffers a full outage, the system can redirect the full event stream to SQS with no downtime.
Conclusion
Canva’s event collection pipeline is a great case of fundamentals done right: strict schemas, decoupled services, typed clients, smart batching, and infrastructure that fails gracefully. Nothing in the architecture is wildly experimental, and that’s the point.
Real systems break when they’re over-engineered for edge cases or under-designed for scale. Canva’s approach shows what it looks like to walk the line: enough abstraction to stay flexible, enough discipline to stay safe, and enough simplicity to keep engineers productive.
For any team thinking about scaling their analytics, the lesson would be to build for reliability, cost, and long-term clarity. That’s what turns billions of events into usable insight.
References:
SPONSOR US
Get your product in front of more than 1,000,000 tech professionals.
Our newsletter puts your products and services directly in front of an audience that matters - hundreds of thousands of engineering leaders and senior engineers - who have influence over significant tech decisions and big purchases.
Space Fills Up Fast - Reserve Today
Ad spots typically sell out about 4 weeks in advance. To ensure your ad reaches this influential audience, reserve your space now by emailing sponsorship@bytebytego.com.
