
Published on February 3, 2025 10:30 AM GMT
This is my project for the AI Safety Fundamentals course.
Abstract
I use Lucent library to produce images that are optimized to give maximum output on some neuron (in my case, linear combinations of two neurons). Then I use CLIP neural network to map those images in the embedding space. Then, I use dimensionality reduction and look for interesting geometry. Here is the code I used.
Getting images
Lucent already has a built-in way to combine objectives (in this case, activations of 2 neurons). But which objectives should it optimize for? At first, I thought to take a grid of linear combinations
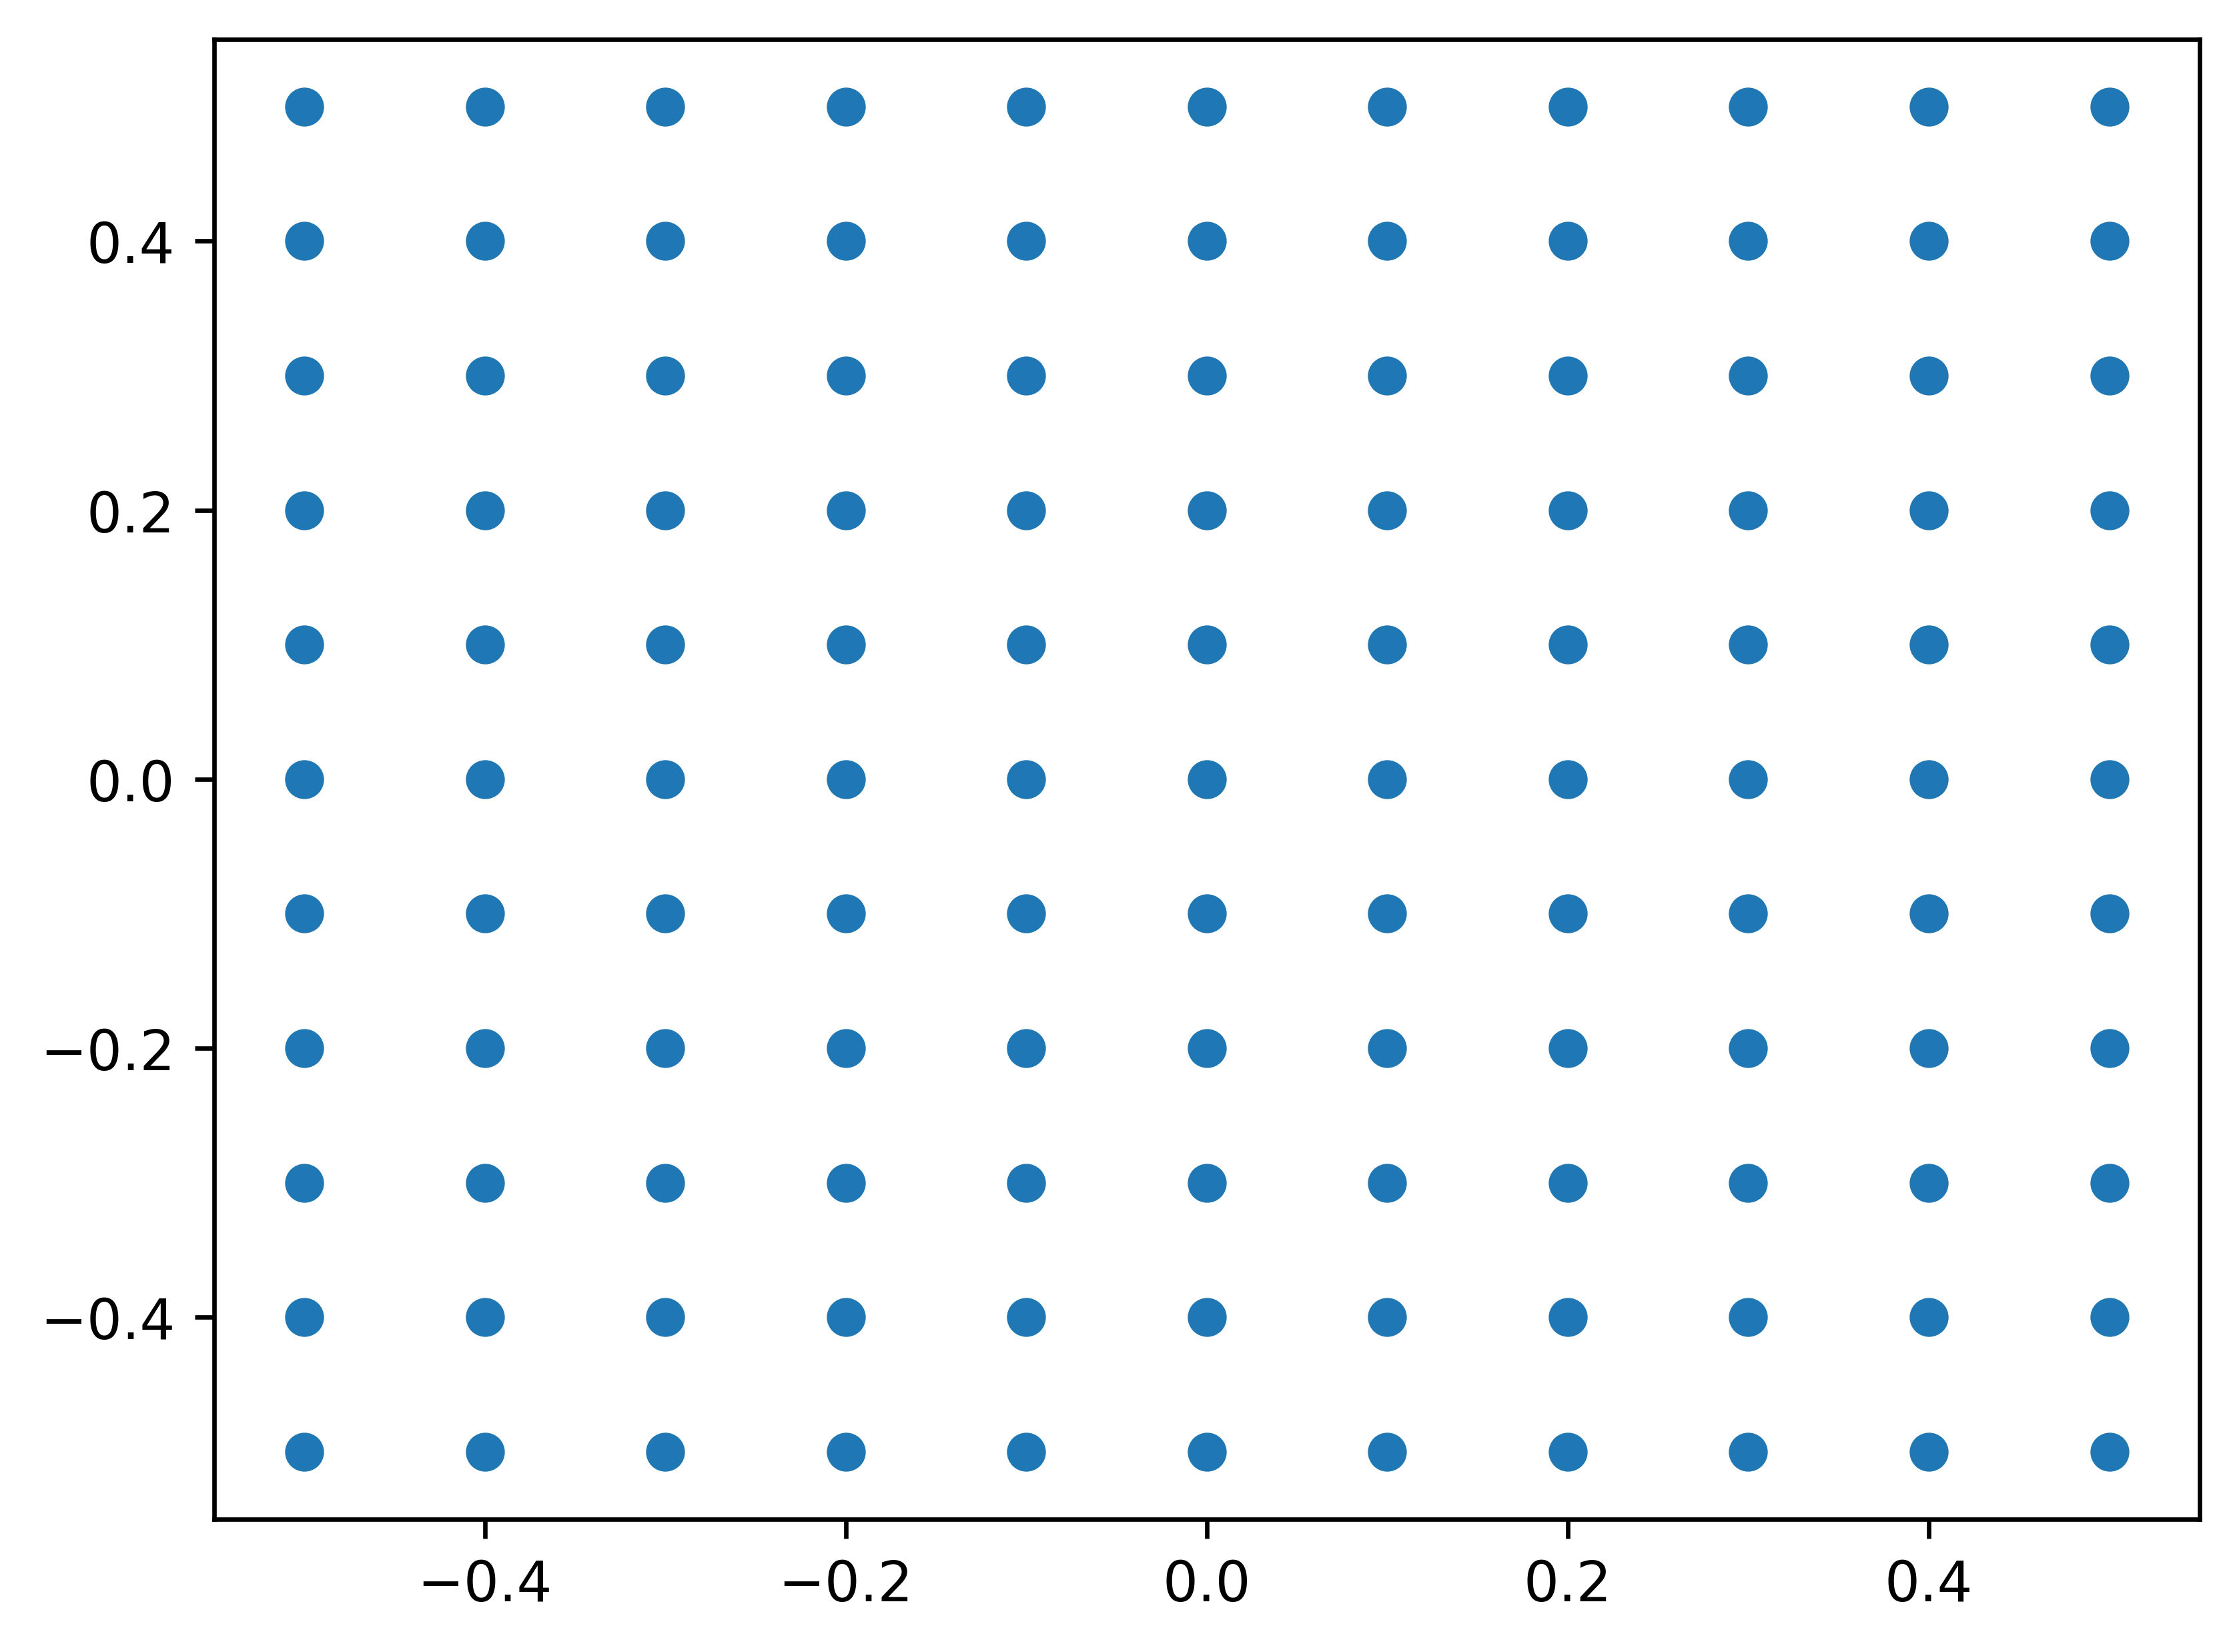
But this is not natural way to do that. It doesn't matter whether is optimized or , the result is going to be the same (because and have the same point of maximum). So I only need to look at linearly independent linear combinations, or directions. I am using circular parametrization
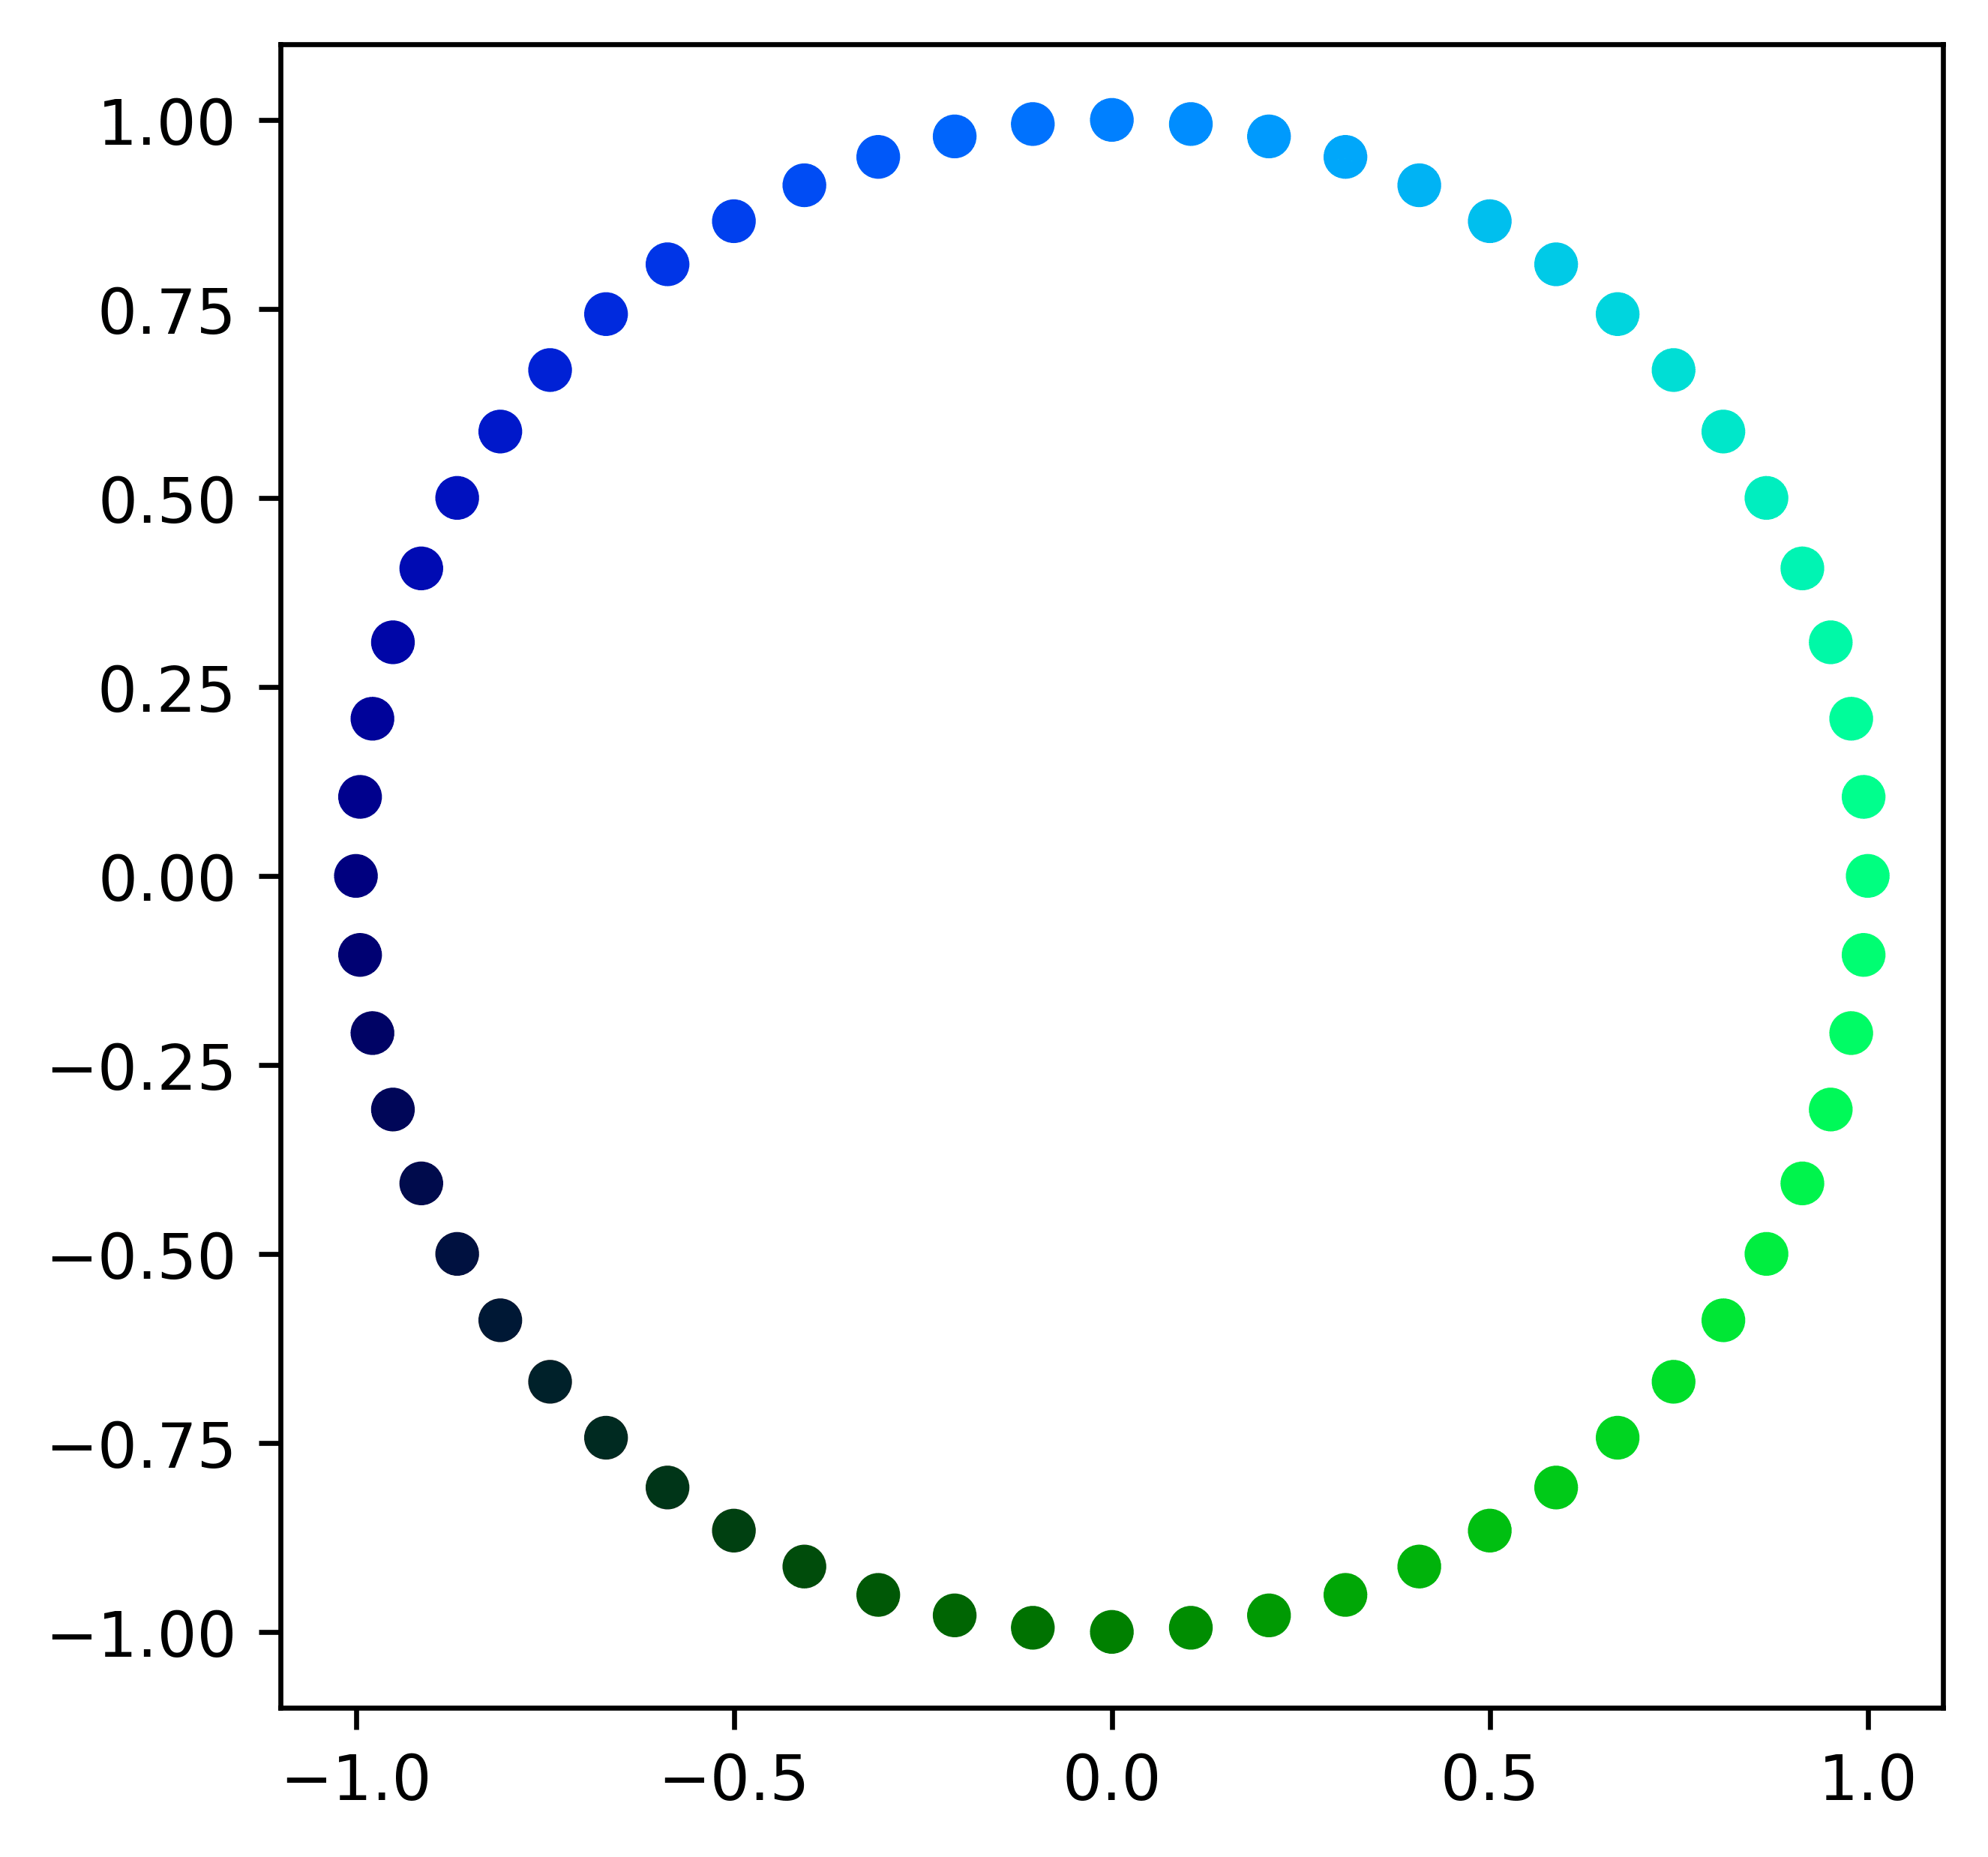
Played back to back, those optimized images make a GIF (the result is flashy so epilepsy warning, the GIF is in the end of the post). Four distinct phases can be noticed, which I assume are related to which neuron has the biggest (in absolute value) coefficient and whether it is being maximized or minimized.
CLIP embeddings
CLIP is a model that is used primarily in order to have a shared embedding space for images and image descriptions. I use it just as a model which gives me low-dimensional vector corresponding to the input image.
But in order to visualize them, those vectors need dimensionality reduction.
Two methods I used:
PCE
Using PCE to reduce 768 dimensions to 2, we get this image
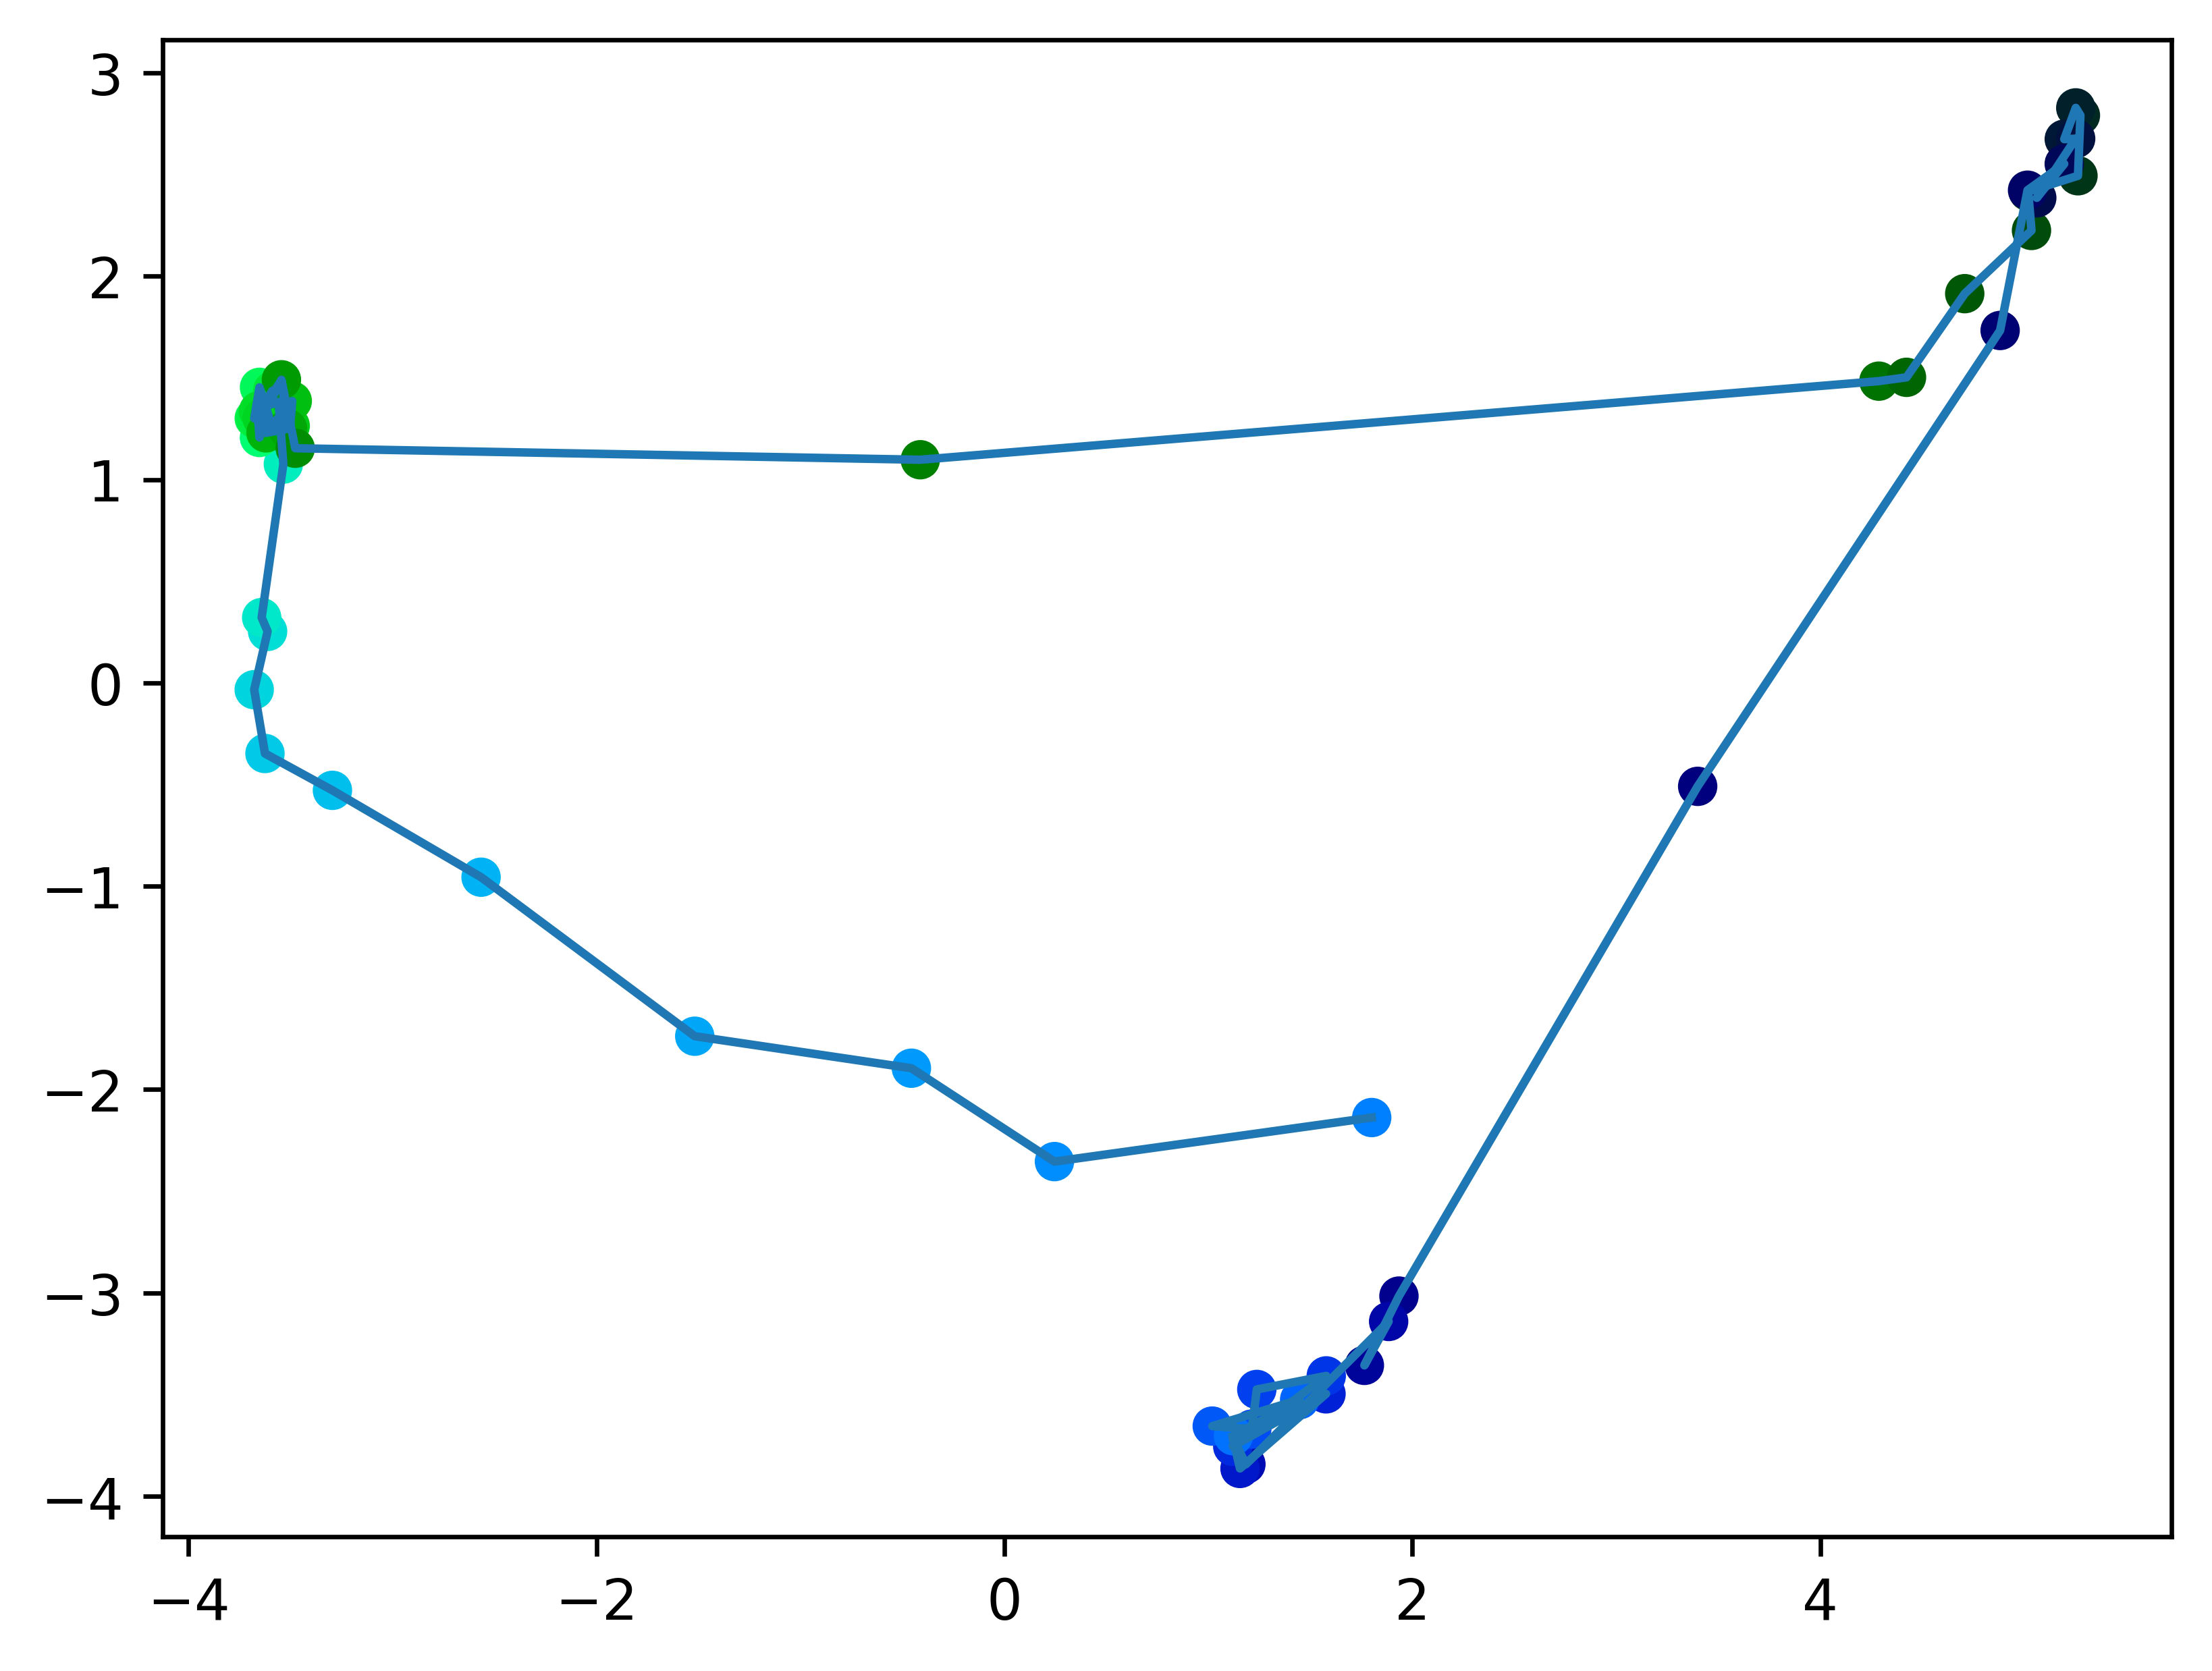
It is circular, as to be expected, though it has 3 distinct clusters (top right, top left, and at the bottom)
Get top 2 dimensions with biggest variance.
This method results in following image
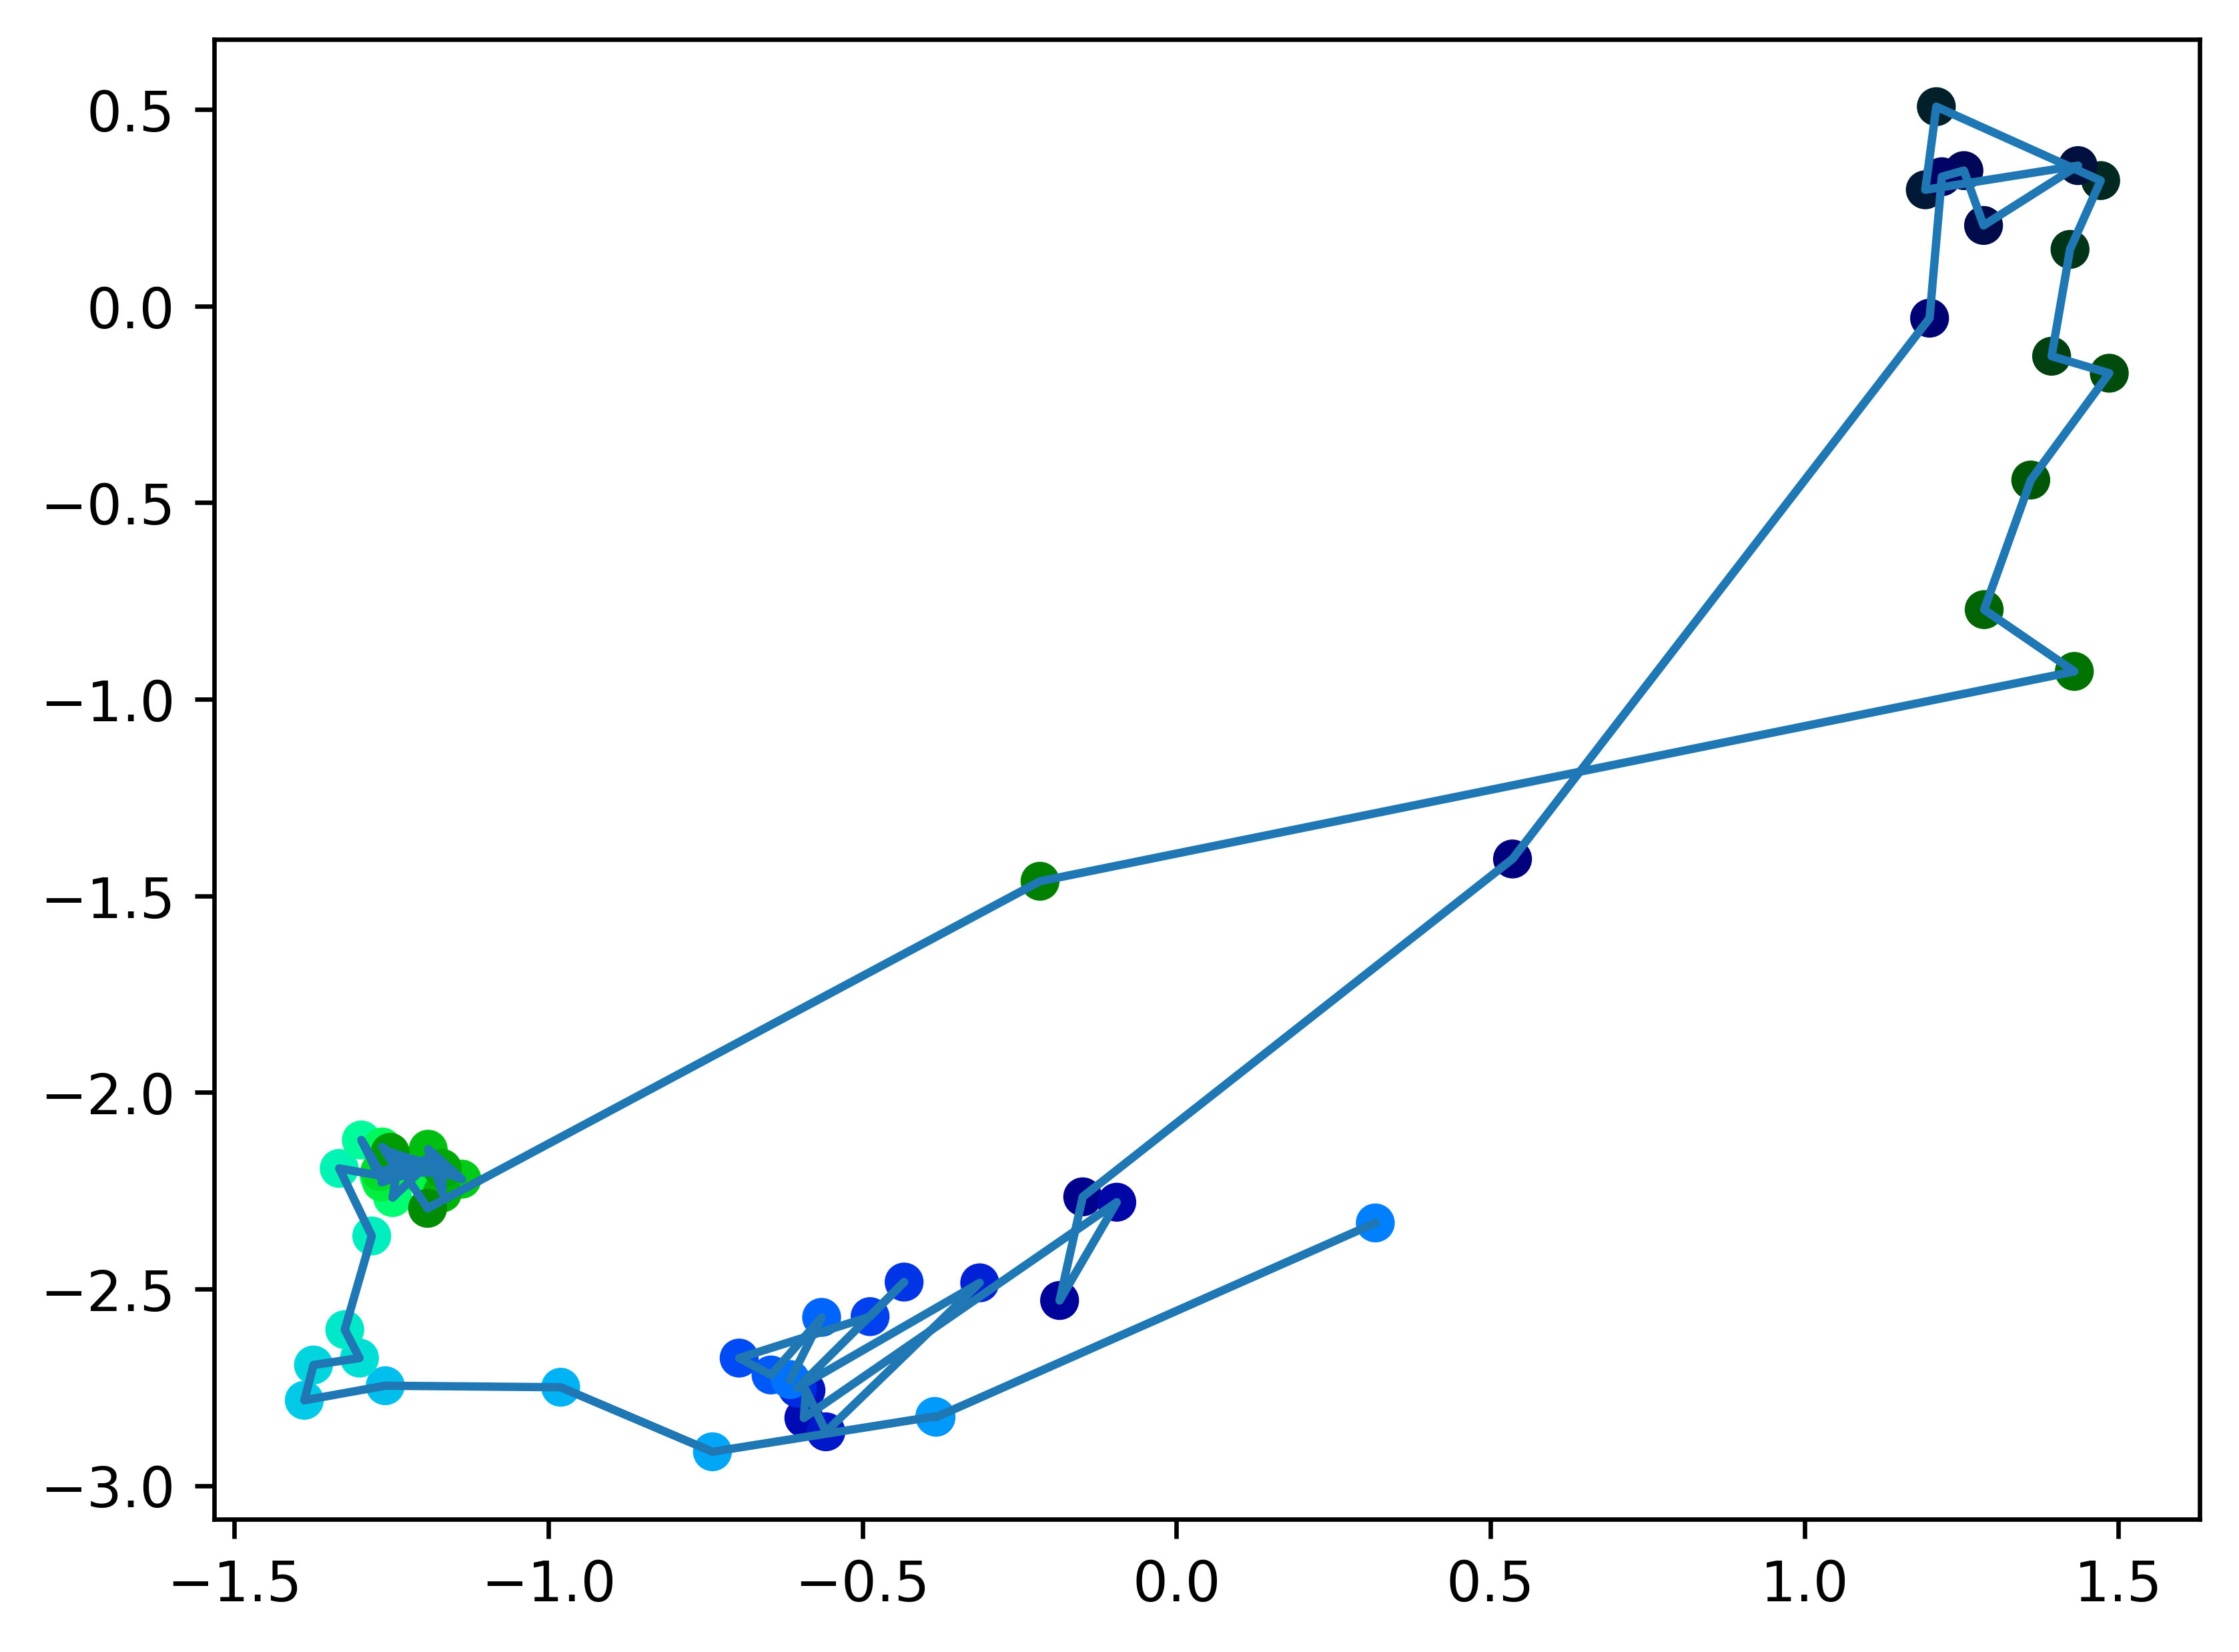
Now it is tangled, but that is probably just an artifact of this particular projection (using the right hyperplane, as in example above, no tangles are formed). Just as in previous examples, 3 distinct clusters can be noticed.
Next steps
Here are a few possible and easy additions to the project
- Experiment with more neurons / visualize more dimensions of the CLIP vectors.Try different dimensionality reduction techniques.Explore what text corresponds to those images.Increase resolution and number of intermediate pictures.
Discuss
