
Published on September 18, 2024 6:44 PM GMT
I have long wanted to write about intention-to-treat because it's such a neat idea, and the recent article How harmful is music, really? spurred me to finally do it.
The reported results were
| Day | Mean mood |
|---|---|
| Music | 0.29 |
| No music | 0.22 |
Making some very rough assumptions about variation, this difference is maybe 1–2 standard errors away from zero, which on could be considered weak evidence that music improves mood.
Except!
There is one big problem with this approach to analysis. Although the experiment started off in a good direction with picking intended music days at random, it then suffered non-compliance, which means the actual days of music are no longer randomly selected. Rather, they are influenced by the environment – which might also influence mood in the same direction. This would strengthen the apparent relationship with no change in the effect of music itself.
The solution is to adopt an intention-to-treat approach to analysis.
Illustrating with synthetic data
I don’t have access to the data dkl9 used, but we can create synthetic data to simulate the experiment. For the sake of this article we’ll keep it as simple as possible; we make some reasonable assumptions and model mood as
This is a bit dense, but it says that our mood at any given time (gi) is affected by four things:
- A baseline mood () which is constant and indicative of our life situation more generally.Our previous mood (), because if we were unusually happy at lunch, some of that mood is likely to linger in the afternoon. The rate of decay is given by the coefficient .Whether we listen to music that day or not (), a term with strength . In case it is not yet clear, the purpose of the experiment is figuring out, from data, if is positive, negative, or zero.Whether we are in a good situation or not that day (), a term with strength . We cannot infer this term from data because it is indistinguishable from the error term, but the reason we still include it in the model will be apparent soon.[1]
Here's an example of what an experiment might look like under this model. The wiggly line is mood, and the bars indicate whether or not we listen to music each day. (The upper bars indicate listening to music, the lower bars indicate no music.)
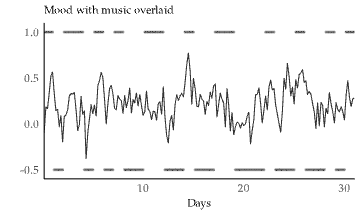
The reason we included the situation si as a separate term is that we want to add a correlation between whether we are listening to music and the situation we are in. This seems sensible – it could be things like
- We love shopping for jeans, and clothes stores tend to play music.We had expected a great time at home listening to music, but ended up having to go out roofing in the rain and cannot bring a speaker because rain.
The model then simulates 25 % non-conformance, i.e. in roughly a quarter of the days we do not follow the random assignment of music. This level of non-conformance matches the reported result of 0.5 correlation between random music assignment and actual music listening.
When we continue to calibrate the model to produce results similar to those reported in the experiment, we get the following constants and coefficients:
The model then results in the following moods:
| Day | Mean mood |
|---|---|
| Music | 0.29 |
| No music | 0.20 |
We could spend time tweaking the model until it matches perfectly[2] but this is close enough for continued discussion.
The very alert reader will notice what happened already: we set , meaning music has no effect on mood at all in our model! Yet it produced results similar to those reported. This is confounding in action. Confounding is responsible for all of the observed effect in this model.
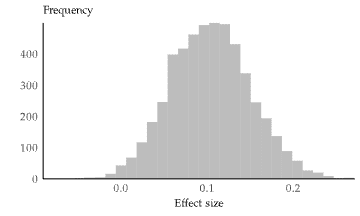
This is also robust in the face of variation. The model allows us to run the experiment many times, and even when we have configured music to have no effect, we get an apparent effect 99 % of the time.
With the naïve analysis we have used so far, the correlation between mood and music is 0.26, with a standard error of 0.10. This indeed appears to be some evidence that music boosts mood.
But it's wrong! We know it is wrong, because we set in the model!
Switching to intention-to-treat analysis
There are two reasons for randomisation. The one we care about here is that it distributes confounders equally across both music days and non-music days.[3] Due to non-compliance, music listening days ended up not being randomly selected, but potentially confounded by other factors that may also affect mood.
Non-compliance is common, and there is a simple solution: instead of doing the analysis in terms of music listening days, do it in terms of planned music days. I.e. although the original randomisation didn't quite work out, still use it for analysis. This should be fine, because if music has an effect on mood, then at least a little of that effect will be visible through the random assignments, even though they didn't all work out. This is called intention-to-treat analysis.[4]
In this plot, the lighter bands indicate when we planned to listen to music, and the darker bands when we actually did so.
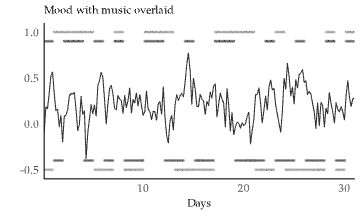
With very keen eyes, we can already see the great effect of confounding on mood. As a hint, look for where the bars indicate non-compliance, and you'll see how often that corresponds to big shifts in mood.
When looking at mood through the lens of when we planned to listen to music, there is no longer any meaningful difference.
| Day | Mean mood |
|---|---|
| Music planned | 0.24 |
| Silence planned | 0.23 |
| Correlation | 0.03 |
| Standard error | 0.03 |
Thus, when we do the analysis in terms of intention-to-treat, we see clearly that music has no discernible effect on mood. This is to be expected, because we set after all, so there shouldn't be any effect.
The cost is lower statistical power
To explore the drawback of intention-to-treat analysis, we can adjust the model such that music has a fairly significant effect on mood. We will make music 4× as powerful as situation.
This new model gives us roughly the same results as reported before when looking purely in terms of when music is playing:
| Day | Mean mood |
|---|---|
| Music | 0.29 |
| No music | 0.21 |
On the other hand, if we look at it through an intention-to-treat lens, we see there is now an effect (as we would expect), although too small to be trusted based on the data alone.
| Day | Mean mood |
|---|---|
| Music planned | 0.26 |
| Silence planned | 0.23 |
| Correlation | 0.09 |
| Standard error | 0.11 |
Remember that we constructed this version of the model to have a definitive effect of music, but because we are looking at it through an intention-to-treat analysis, it becomes harder to see. To bring it out, we would need to run the experiment not for 31 days, but for half a year!
Such is the cost of including confounders in one's data: they make experiments much more expensive by virtue of clouding the real relationships. Ignoring them does not make things better, it only risks producing mirages.
Brief summary of findings
To summarise, these are the situations we can find ourselves in:
| Analysis type | Significant effect | Non-significant effect |
|---|---|---|
| Naïve | Actual or confounder | Actual |
| Intention-to-treat | Actual | Actual or confounder |
In other words, by switching from a naïve analysis to an intention-to-treat analysis, we make confounders result in false negatives rather than false positives. This is usually preferred when sciencing.
- ^
Actually, since the situation is based on days and there are six measurements per day, we might be able to infer this parameter from data also. But we will not.
- ^
I know because we have something like 7 degrees of freedom for tweaking, and we only need to reproduce 5 numbers with them.
- ^
The other purpose of randomisation is to make it possible to compute the probability of a result from the null hypothesis.
- ^
This is from the medical field, because we randomise who we intend to treat, but then some subjects may elect to move to a different arm of the experiment and we can’t ethically force them to accept treatment.
Discuss
