
Published on July 17, 2025 8:10 PM GMT
I’m currently investigating ketamine, with the goal of assessing the risks of chronic use. For reasons I will get into in the real post, this is going to rely mostly on in vitro data, at least for neural damage, which means I need a way to translate real-world dosages into the concentration of ketamine in the brain. This post gets into those details so I can use it as a reference post for the one you actually want to read, and invite correction early from the three of you who read it all the way through.
If you’re excited for the main post (or for some inexplicable reason, this post), you can help me out by tax-deductibly donating to support it, or joining my (not tax deductible) Patreon.
Cliff Notes
What I care about for purposes of the next post is the concentration of ketamine in the brain. Unfortunately, ethics committees really hate when you set up a tap in people’s skulls and draw a fresh sample every five minutes. The best you can do is a lumbar puncture, which draws cerebrospinal fluid (CSF) from the spine. Unfortunately, spinal fluid and cranial fluid concentrations are not interchangeable. Tentatively, brain concentrations of most substances in this class tend to be lower, so we can still use CSF concentrations as a rough upper bound.
Most long-term, medically supervised ketamine users use a lozenge or nasal spray.. However, the only paper that measures ketamine in the cerebrospinal fluid delivered the ketamine by IV. Therefore, to have any hope of contextualizing the in vitro data, I need to translate from ketamine dose (nasal or lozenge) (measured in either straight milligrams, or milligrams per kilogram of body weight) -> plasma concentration -> CSF concentration (also measured in nano- or micro-grams of ketamine per milliliter of fluid).
There are two metrics we might consider when comparing doses of drugs. The first is peak concentration, which is the highest dose of ketamine your brain experiences at any point. The second is the total cumulative exposure (AKA area under the curve or AUC). These unfortunately have pretty different translations from IV to sublingual doses, and unfortunately I saw no evidence about which of these was more important. I report both just in case.
Assuming (incorrectly) a linear response, 1 mg of ketamine taken sublingually (under the tongue) or buccally (in the cheek) leads to a mean peak concentration in plasma (blood) of 0.83 – 2.8 ng/ml and a mean total dose (area under curve, AUC) of 1.8-7.4 ng/ml.
1 mg of ketamine taken via a nasal spray leads to a mean peak in plasma of 1.2 ng/ml and a mean total dose of 3 ngh/ml (based on a single study).
Peak CSF concentration was 37% of plasma concentration, and came 80 minutes later. Total CSF dose was 92% of total plasma dose, indicating almost total diffusion into CSF, eventually. Both findings are from a single study.
Combining these two results, 1mg sublingual ketamine leads to a median measured peak brain concentration of < 1.1 ng/ml and a total brain dose of < 6.7ngh/ml.
On the other hand, 1mg nasal ketamine leads to a median peak concentration of < 0.45 ng/ml and median measured total brain dose of < 2.7ngh/ml.
The rest of the post goes more deeply into the findings and methodology of individual papers.
Context and Caveats
Like most 3D molecules, ketamine exists in two forms that are mirror images of each other (called enantiomers). One version is sold under the name eskatamine; the other is not commercially available on its own). Some papers administered only esketamine, some both separately, and some both together (a racemic mix). The pharmacokinetics of these aren’t different enough to be worth distinguishing for my purposes.
My list of papers is cribbed from Undermind.AI. I occasionally found papers via references, but when I checked those papers were always on Undermind’s list as well. I also looked on Perplexity, but it found only a subset of the papers on Undermind (Perplexity has tragically enshittified over the last few months).
I treat the translation of dose to concentration in the body as linear. This is almost certainly false, but more likely to be an overestimate.
I did not even attempt to combine results in some sort of weighted fashion, which would have incorrectly combined subtly different mechanisms of delivery. The numbers you see above are the range of values I saw.
“Peak” concentration always means “among times samples were taken”, not actual peak.
I mentioned that I assume a linear dose-concentration curve to ketamine (meaning that if you double the amount of ketamine you take, you get double the plasma or CSF concentration). Linear sounds like a nice safe assumption, but it can go wrong in both directions. Your body may absorb a substance less efficiently as you take more, leading to an asymptotic curve. Or your body may only be able to clear so much of a substance at a time, so an increased dose has an outsized impact on concentration. In the case of ketamine there’s very mild evidence that the curve is sublinear, which makes treating it as linear an overestimate. That’s the direction I want to err on, so I went with linear.
Translating nasal/sublingual doses to plasma concentration
To find out what dose translates to what plasma concentration, we need to give subjects ketamine through whatever route of administration, take repeated blood samples, and measure the concentration of ketamine in that blood. My ideal paper had the following traits:
- Studied adult humans.Delivered ketamine nasally, sublingually, or buccally.Sampled plasma at least every 10 minutes for the first hour, ideally more often. Only a handful of papers met this criteria, so I had to give a little on this criteria. Tracked concentration and total dose received.
Combining the results below, and assuming (incorrectly) a linear response I get the following results:
- 1 mg of ketamine taken sublingually or buccally leads to a mean peak concentration in plasma (blood) of 0.83 – 2.8 ng/ml and a mean total dose (area under curve, AUC) of 1.8-7.4 ng/ml1 mg of ketamine taken nasally leads to a mean peak in plasma of 1.2 ng/ml and a mean total dose of 3 ngh/ml (based on a single study).
S-Ketamine Oral Thin Film—Part 1: Population Pharmacokinetics of S-Ketamine, S-Norketamine and S-Hydroxynorketamine
This paper was definitely selling something and that thing is an “oral thin film” delivery mechanism.
This study design is a little complicated. N=15 people were given one and two sublingual films (50mg S-ketamine each) on two separate occasions (so everyone received 150mg total, over two doses), and ordered not to swallow for 10 minutes (I have my doubts). Another 5 were given the same doses, but buccally (in the cheek). Buccal and sublingual had indistinguishable pharmacokinetics (at their tiny sample sizes) so we’ll treat them as interchangable from now on. Subjects had blood samples taken at t = 0 (= oral thin film placement) 5, 10, 20, 40, 60, 90, 120, 180, 240, 300, 360 minutes, after which they were given 20mg IV ketamine over 20 minutes, with new samples taken at 2, 4, 10, 15, 20, 30, 40, 60, 75, 90, and 120 min.
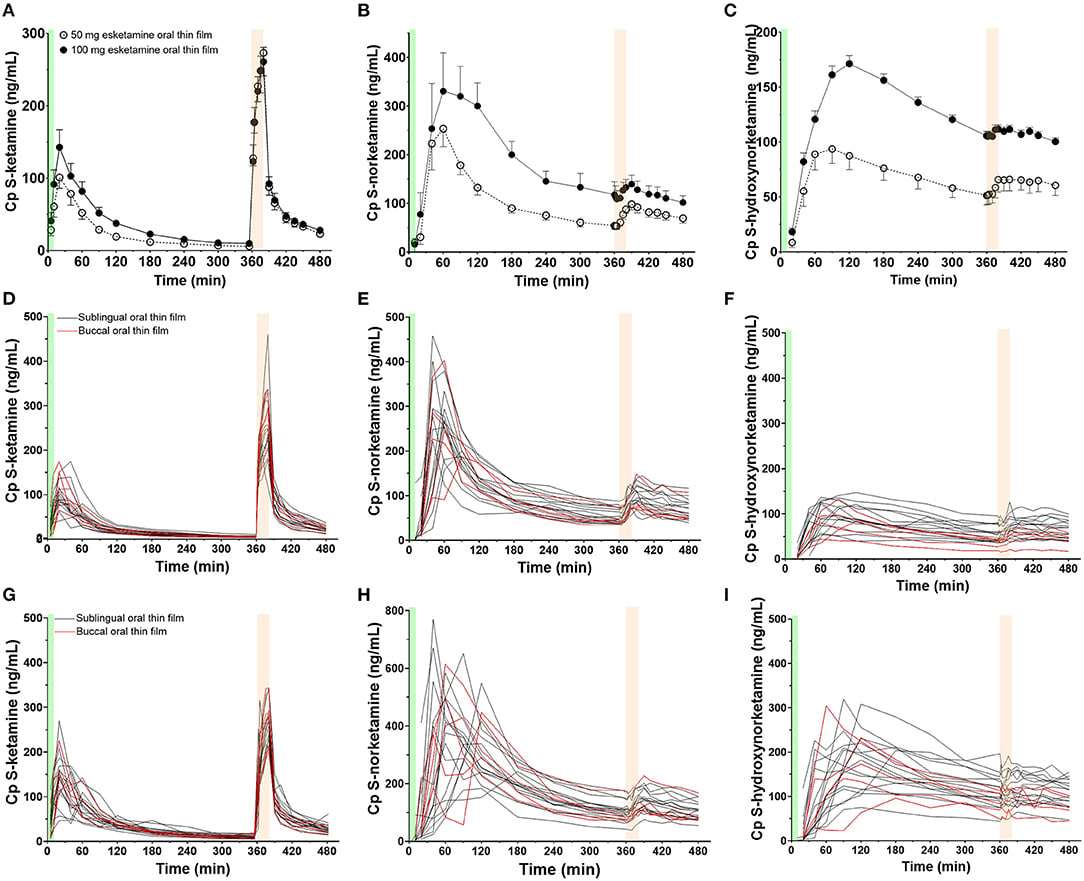
Figure 1. Mean measured plasma concentrations following application of the 50 and 100 mg S-ketamine oral thin film (OTF): (A) S-ketamine, (B) S-norketamine, and (C) S-hydroxynorketamine. Individual concentrations are given in panels (D–F) for the 50 mg oral thin film and (G–I) for the 100 mg oral thin film. In black the results of placement below the tongue, in red buccal placement. The OTF was administered at t = 0 min for 10 min (green bars); at t = 360 min, an intravenous dose of 20 mg S-ketamine was administered over 20 min (light orange bars).
There’s a few key points to take from this graph. First, sublingual (under the tongue) and buccal (between cheek and gum) are indistinguishable, at least at this sample size. Second, the 100mg sublingual dose doesn’t have near double peak concentration or AUC of the 50mg dose, although this is not statistically significant. You can see the exact numbers in table 1.
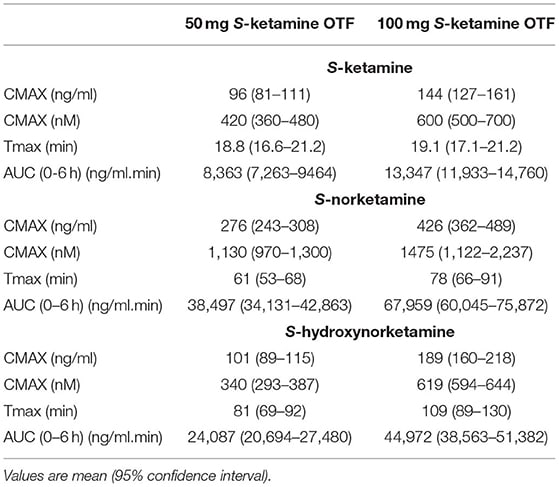
(CMAX = peak concentration, Tmax = time to peak concentration, S-norketamine = a psychoactive metabolite of ketamine, S-hydroxynorketamine=an inactive metabolite of ketamine)
Given that, we have, for peak concentration
50 mg = 96ng/ml -> 1mg = 1.9ng/ml
100 mg = 144ng/ml -> 1mg = 1.4ng/ml
Which makes a linear dose-concentration relationship look unlikely, although at these sample sizes the difference isn’t significant.
For AUC:
50mg = 8362 ngmin/ml -> 1mg = 170 ngmin/ml
100mg = 13,347 ngmin/ml -> 1mg = 130ngmin/ml
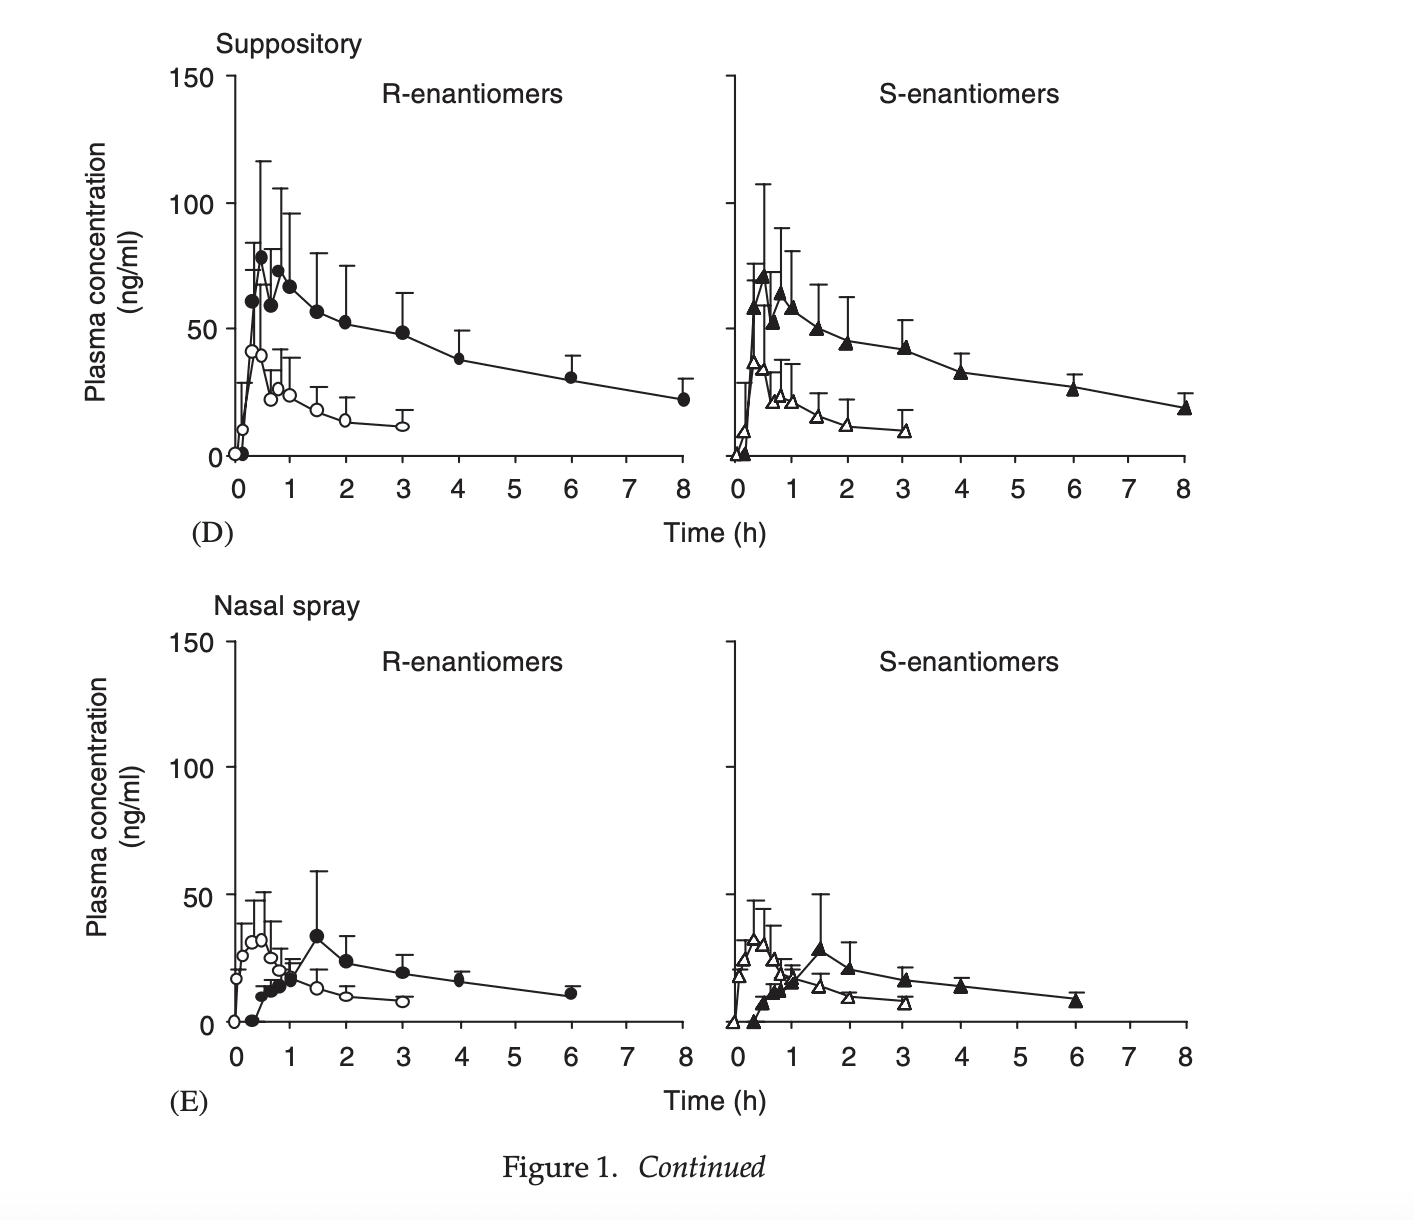
Plasma concentration profiles of ketamine and norketamine after administration of various ketamine preparations to healthy Japanese volunteers
This is my favorite paper, looking at no fewer than 5 different methods of delivery.
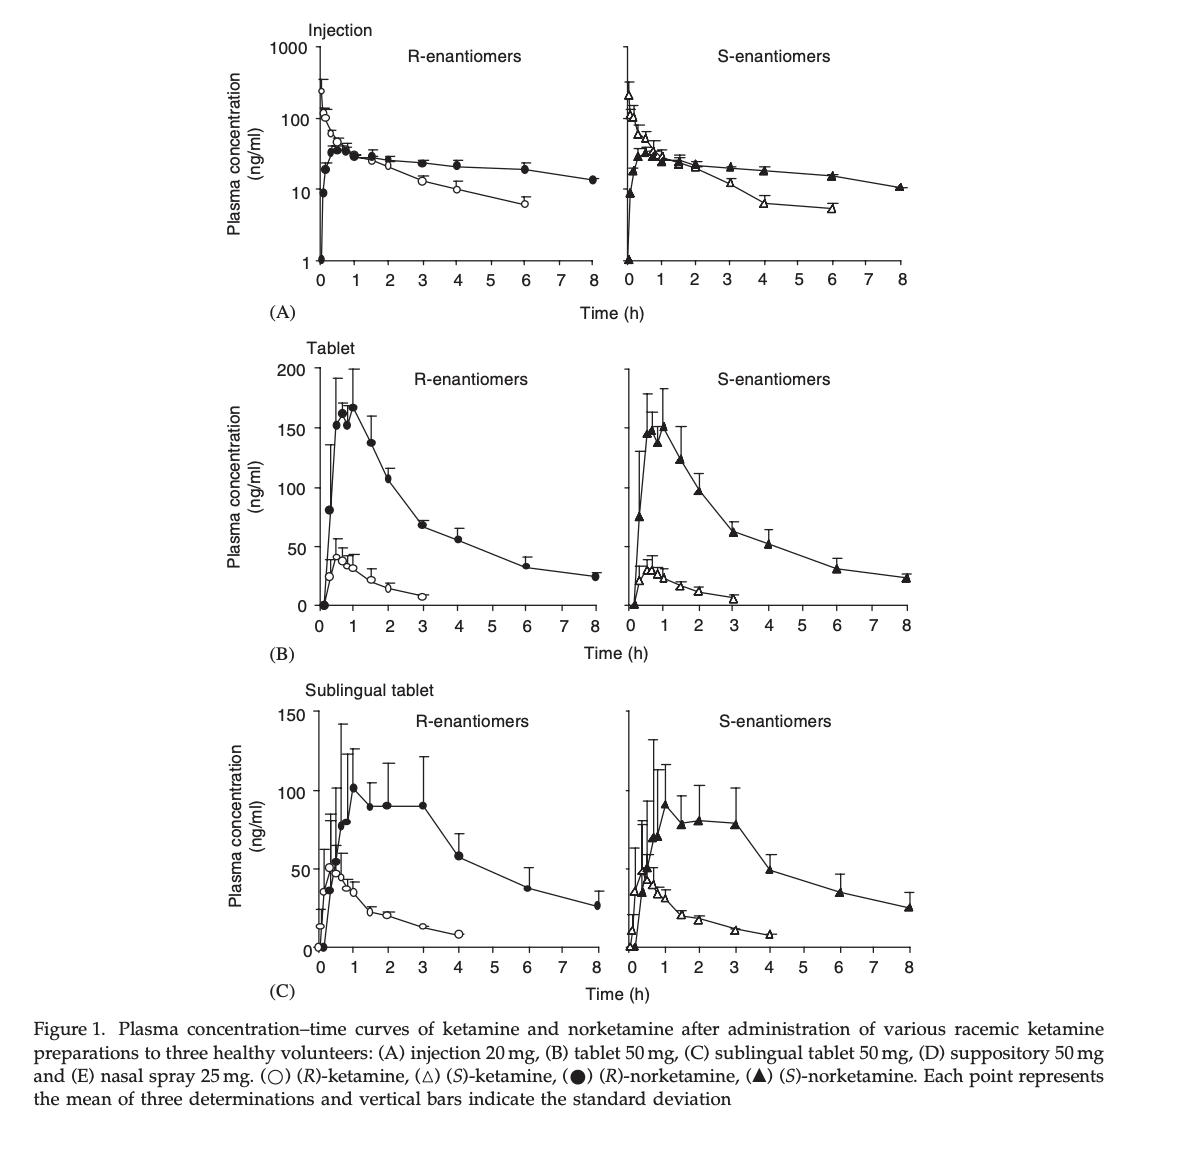
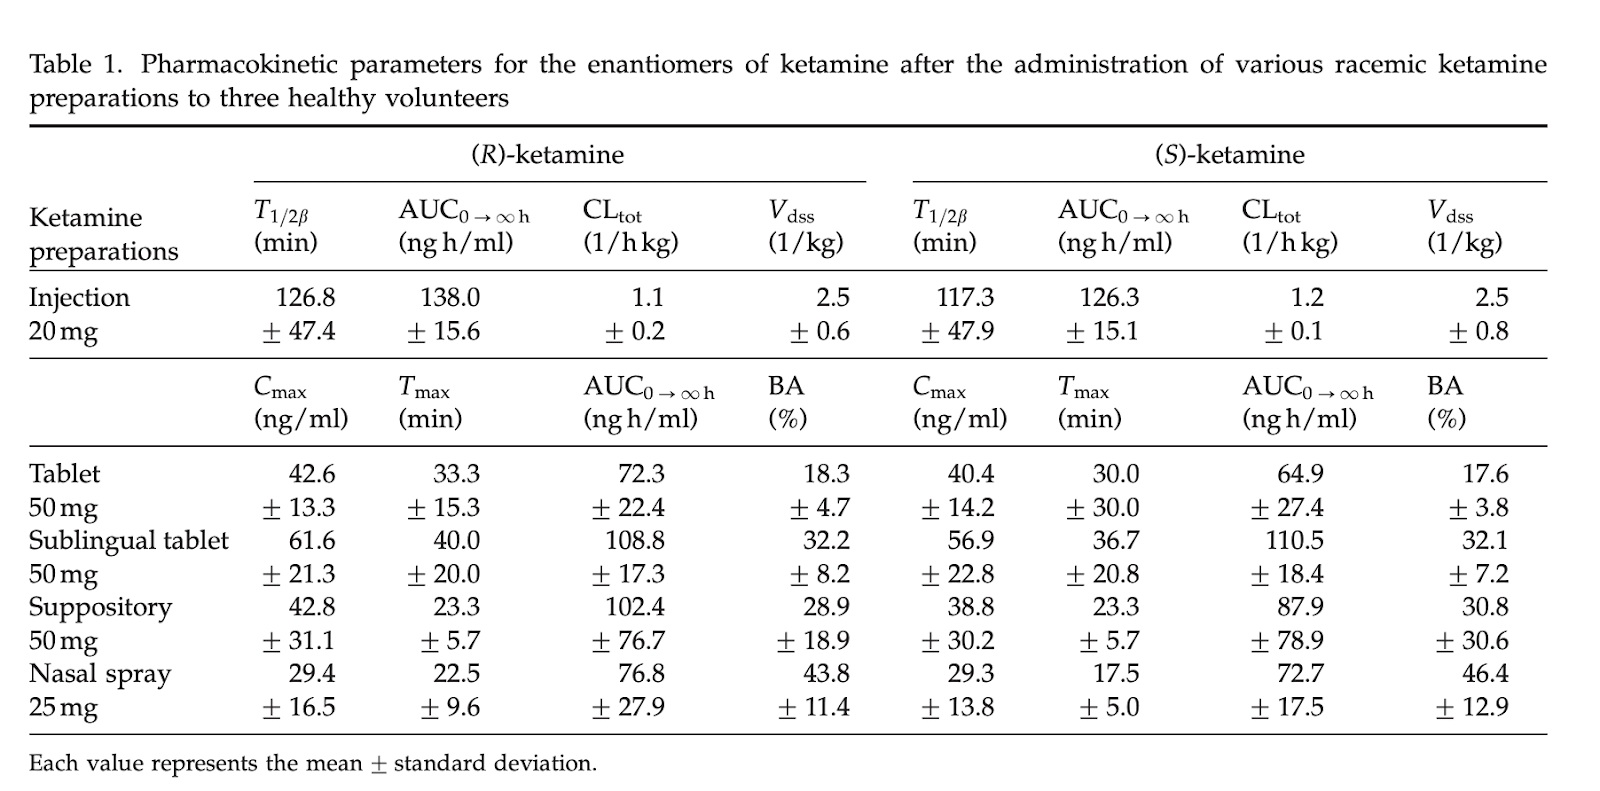
This isn’t the primary take-home, but because they injected racemic ketamine but measured the two enantiomers (S- and R- ketamine) we can see that their pharmacokinetics are close enough that I can ignore the difference between them, and use S-ketamine data to inform estimates of racemic ketamine. For the results below I averaged the S- and R- results together
The only routes of administration I care about from this list are sublingual tablet and nasal spray.
For peak concentration, we see:
50 mg sublingual = (42.6+40.4)/2 ng/ml -> 1 mg = 0.83ng/ml
25mg nasal spray = (29.4+29.3)/2 ng/ml -> 1 mg = 1.2 ng/ml
For area under the curve, we see:
50 mg sublingual = (108.8+110.5)/2 ngh/ml -> 1 mg = 2.2ngh/ml = 130 ngmin/ml
25mg nasal spray = (76.8+72.7)/2 ngh/ml -> 1 mg = 3 ngh/ml = 180 ngmin/ml
The absolute bioavailability of racemic ketamine from a novel sublingual formulation
You know the drill: 8 subjects were given 25mg sublingual or 10mg IV ketamine
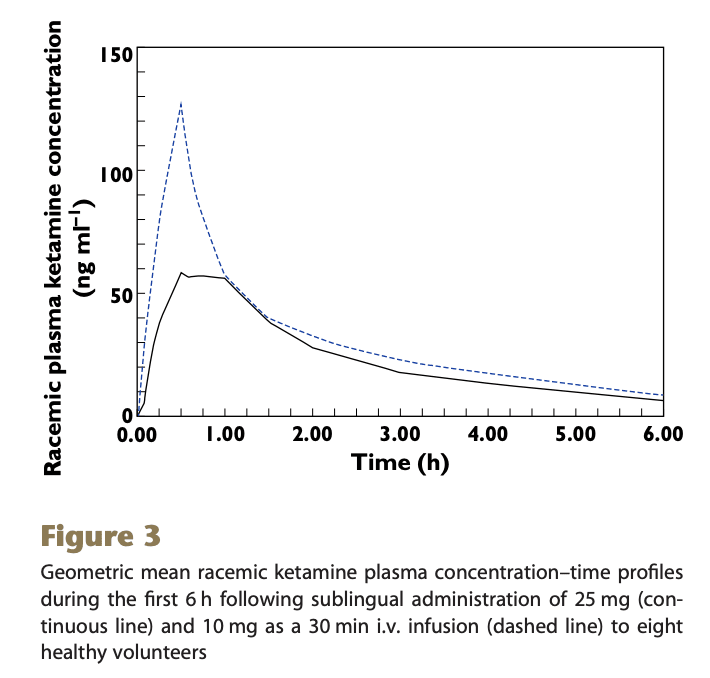
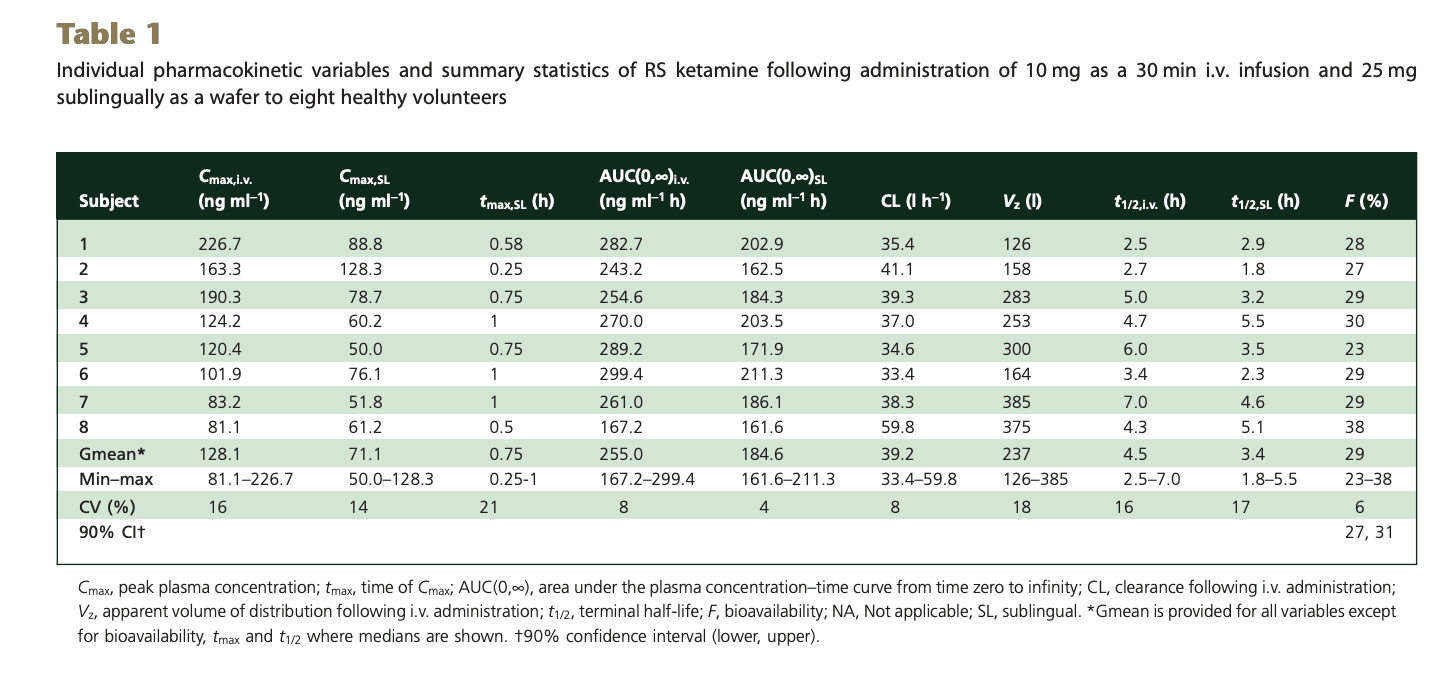
This paper uses geometric mean (the nth root of n numbers multiplied together) rather than arithmetic (sum of numbers divided by their count), so is not directly comparable to the other studies. But roughly, for peak concentration (Cmax) of the sublingual dose:
25 mg ketamine = 71.1 ng/ml -> 1mg = 2.8 ng/ml
And for total dose (AUC)
25 mg ketamine = 184.6 ngh/ml -> 1 mg ketamine = 7.4 ngh/ml = 443 ng*min/ml
Why I’m ignoring ketamine’s chirality
Combined Recirculatory-compartmental Population Pharmacokinetic Modeling of Arterial and Venous Plasma S(+) and R(–) Ketamine Concentrations
10 healthy male subjects aged 24 to 62 yr, weighing 68 to 92 kg, were administered approximately 7 mg of S(+) or R(–) ketamine via a 30-min constant rate IV infusion on two occasions at least 3 days apart. Radial artery and arm vein samples were drawn at 0, 5, 10, 15, 20, 25, 30, 40, 50, 60, 120, 180, and 300 min after the start of the S(+) ketamine infusion and at 0, 5, 10, 15, 20, 25, 30, 36, 43, 50, 180, 300, and 420 min after the start of the R(–) ketamine infusion.
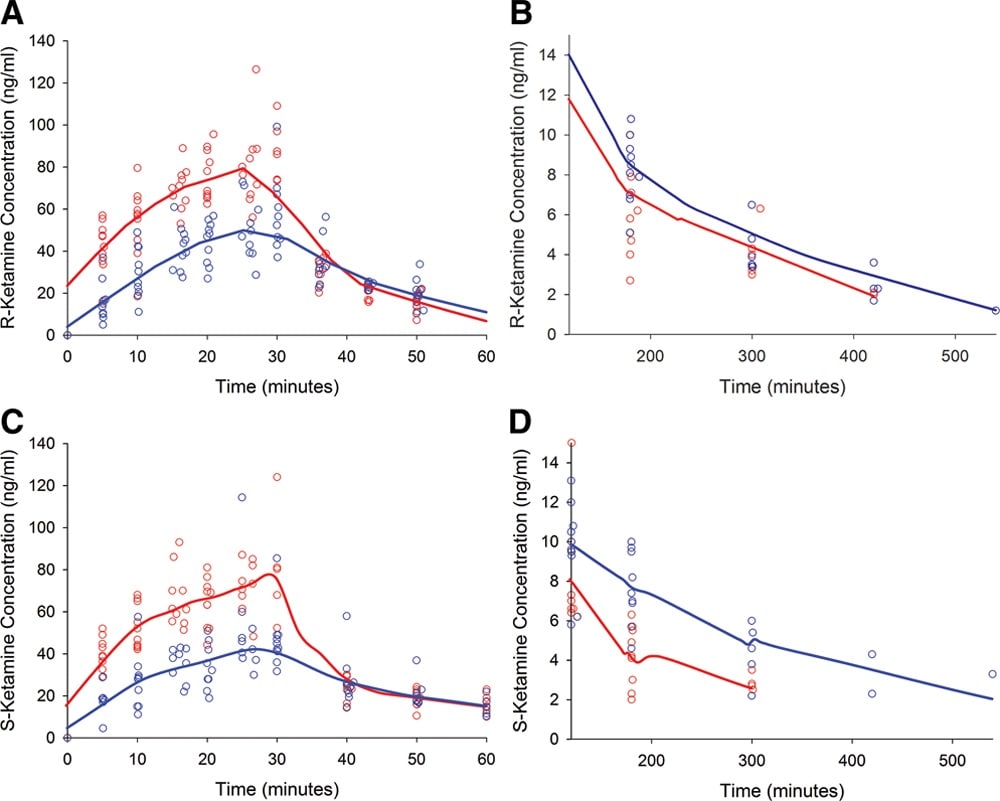
Red = arterial blood, Blue = venous blood
As you can see, arterial and venous blood are quite different, but S- and R- ketamine are close enough for government work.
Translating plasma concentrations to cerebrospinal fluid concentrations
Cerebrospinal fluid exploratory proteomics and ketamine metabolite pharmacokinetics in human volunteers after ketamine infusion
These heroes gave a dose of ketamine via IV, then monitored both plasma concentration and cerebrospinal fluid.
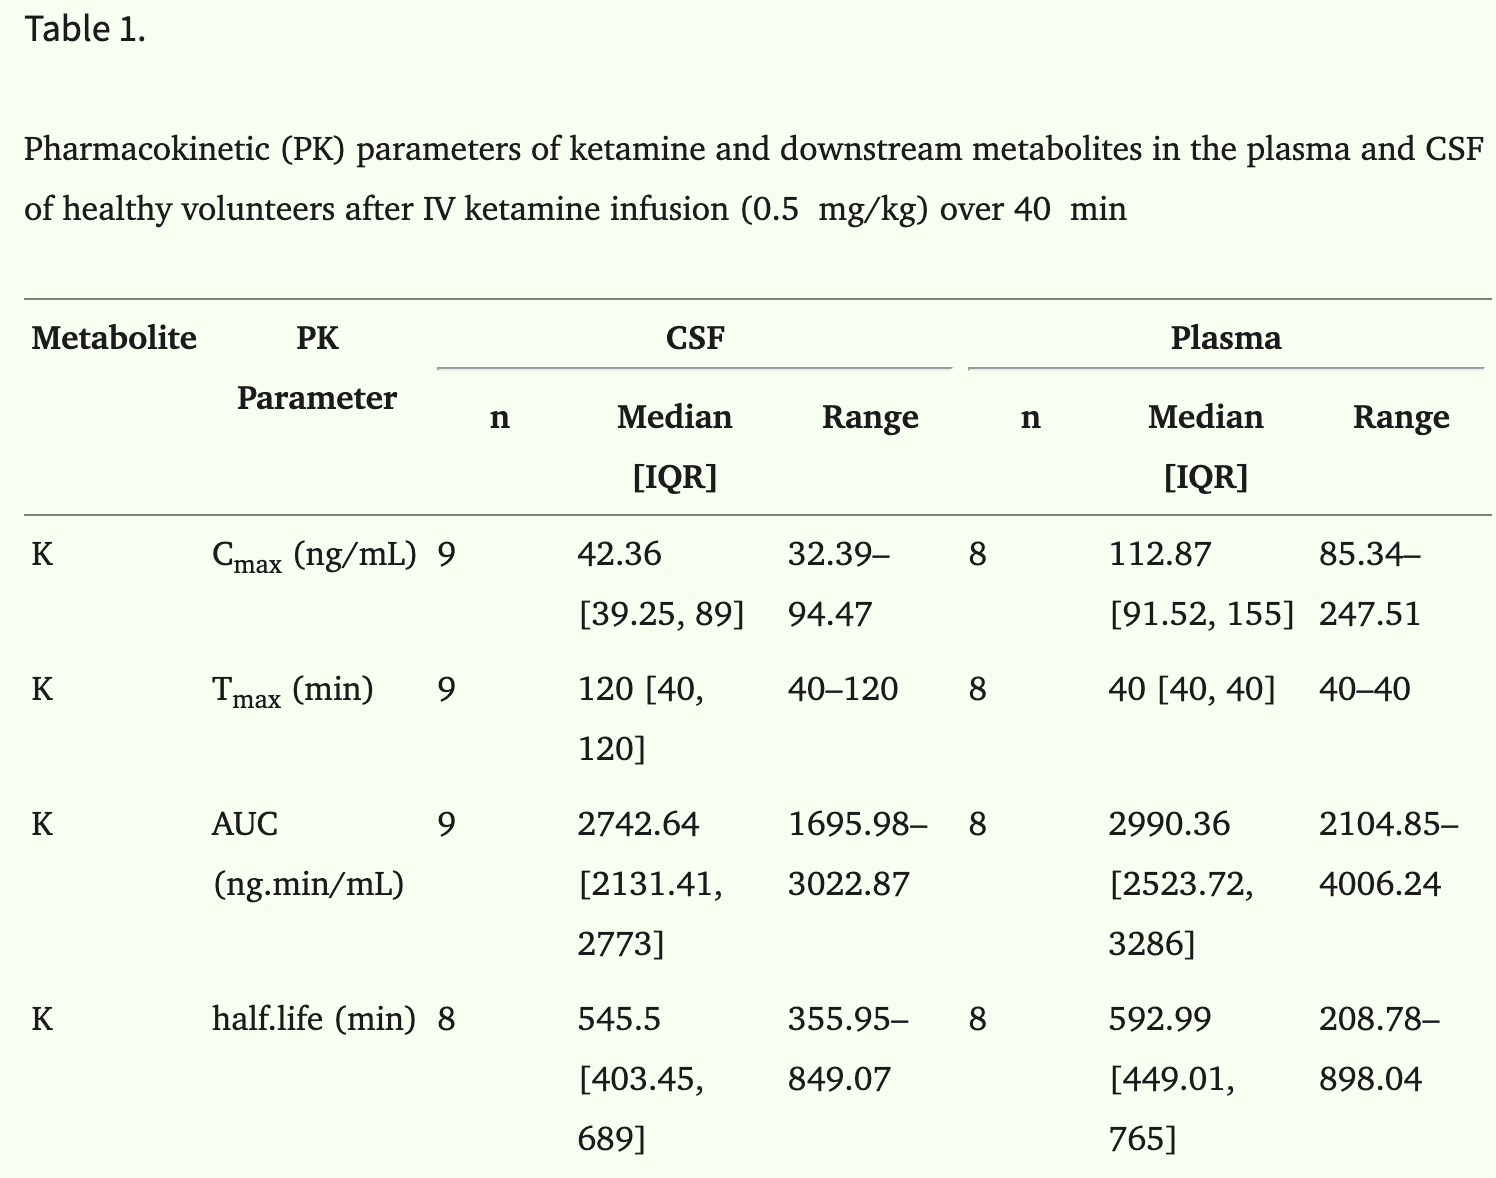
Peak CSF concentration was 37% of plasma concentration, and came 80 minutes later.
Total CSF dose was 92% of total plasma dose, indicating almost total diffusion into CSF, eventually.
Papers I Want to Complain About
Bioavailability, Pharmacokinetics, and Analgesic Activity of Ketamine in Humans
I mention this paper only to explain why I am mad at it. This 1981 study took beautiful measurements of pain sensitivity as well as plasma concentration of ketamine, and then didn’t publish any of them. They used only intramuscular injection and oral solution, which doesn’t allow me to translate to the more standard IV concentration. Also oral is a terrible route for ketamine, your body processes most of it before it hits your system.
Population pharmacokinetics of S-ketamine and norketamine in healthy volunteers after intravenous and oral dosing
For reasons I don’t understand, this paper studies IV alone versus IV + oral ketamine together. Also not useful for our purposes, except for establishing that ketamine taken orally (as in, a pill you swallow and absorb through the digestive track) isn’t very good.
Development of a sublingual/oral formulation of ketamine for use in neuropathic pain
This paper measured concentration in arterial blood, where every other paper used venous blood. One paper that measured both showed that they were shockingly different. I could attempt to translate from arterial to venous concentrations, but the paper also uses an unpopular delivery mechanism so I haven’t bothered.
Acknowledgements
Thanks to R. Craig Van Nostrand for statistical and paper-reading help, Anonymous Weirdo for many discussions on pharmacokinetics, Ozy Brennan and Justis Mills for editing, and my Patreon patrons and Timothy Telleen-Lawton for financial support.
Discuss
