
Published on July 13, 2025 6:26 PM GMT
by Hans Gundlach, Jayson Lynch, Matthias Mertens, Neil Thompson
(All researchers are part of MIT Futuretech)
Epistemic Status: This is a work in progress, and we would appreciate criticism as well as suggestions in all aspects of this work.
TLDR: We estimate that general inference efficiency increases 3-10x per year. This rate reflects the decrease in the price of inference after attempting to isolate out market competition and hardware effects. However, there is still significant uncertainty in our estimates.
Intro: Algorithmic Progress
Recent advances in AI have shown that improvements in algorithms can yield performance gains far beyond what hardware improvements alone would provide. For example, innovations in transformer architectures, optimization techniques, and inference-time strategies have contributed to substantial reductions in compute requirements for a given level of capability.
While the rate of algorithmic progress in AI training has been estimated at around 3× efficiency gains per year—effectively tripling the usable training compute annually—there has been little systematic work quantifying progress in inference efficiency. Yet inference is crucial: it determines how cheaply models can be deployed, how many “virtual workers” can operate in parallel, and how accessible powerful AI systems become over time. Progress in inference is also a crucial parameter in models of AI recursive self-improvement (see June-July AI 2027) and future scaling of AI labor. This question has gained urgency in light of advances like RL-based training and inference time scaling, where inference computation can dramatically improve capabilities.
It is difficult to quantify the importance of the sources of inference efficiency improvements. Companies do not generally release inference efficiency statistics. Further, many inference advances involve multiple GPUs or large querying and batching (e.g., speculative sampling, continuous batching, paged attention, etc), which makes it hard to measure hardware usage explicitly. However, if markets for open LLM services are competitive, then changes in the price of inference should be a good proxy for changes in inference efficiency. Therefore, in this analysis, we aim to estimate the historical rate of algorithmic progress in inference efficiency using inference prices, attempting to distinguish it from gains driven purely by hardware advances or market factors.
Method 1: Bucketing by Benchmark Quality Level
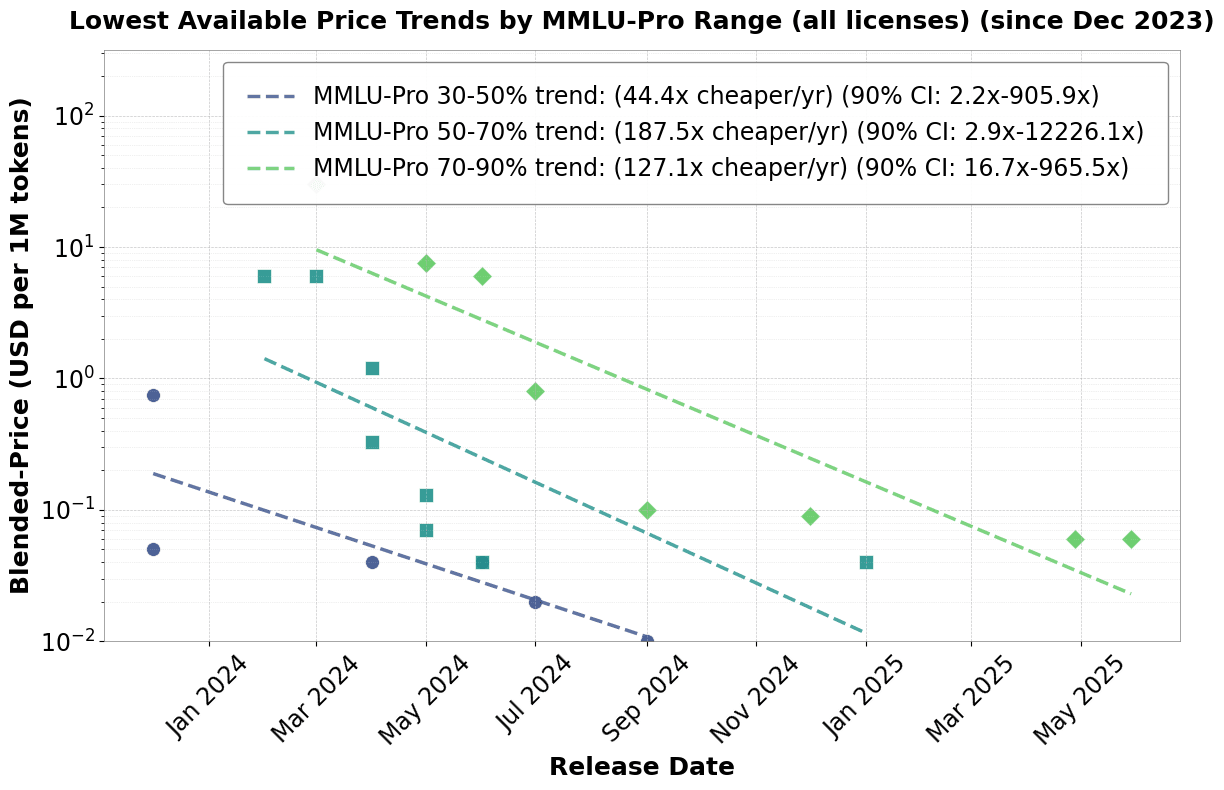
Fig 1: Overall (without license restriction) trend in the lowest available LLM inference prices in a given MMLU level. Data taken from Artificial Intelligence. Trends around May of 2024 do not appear linear and may reflect market dynamics where the availability of cheap open-source models leads to lower prices on subsequent proprietary models. Note, these are current prices, but proprietary model builders tend not to change the inference price of older models.
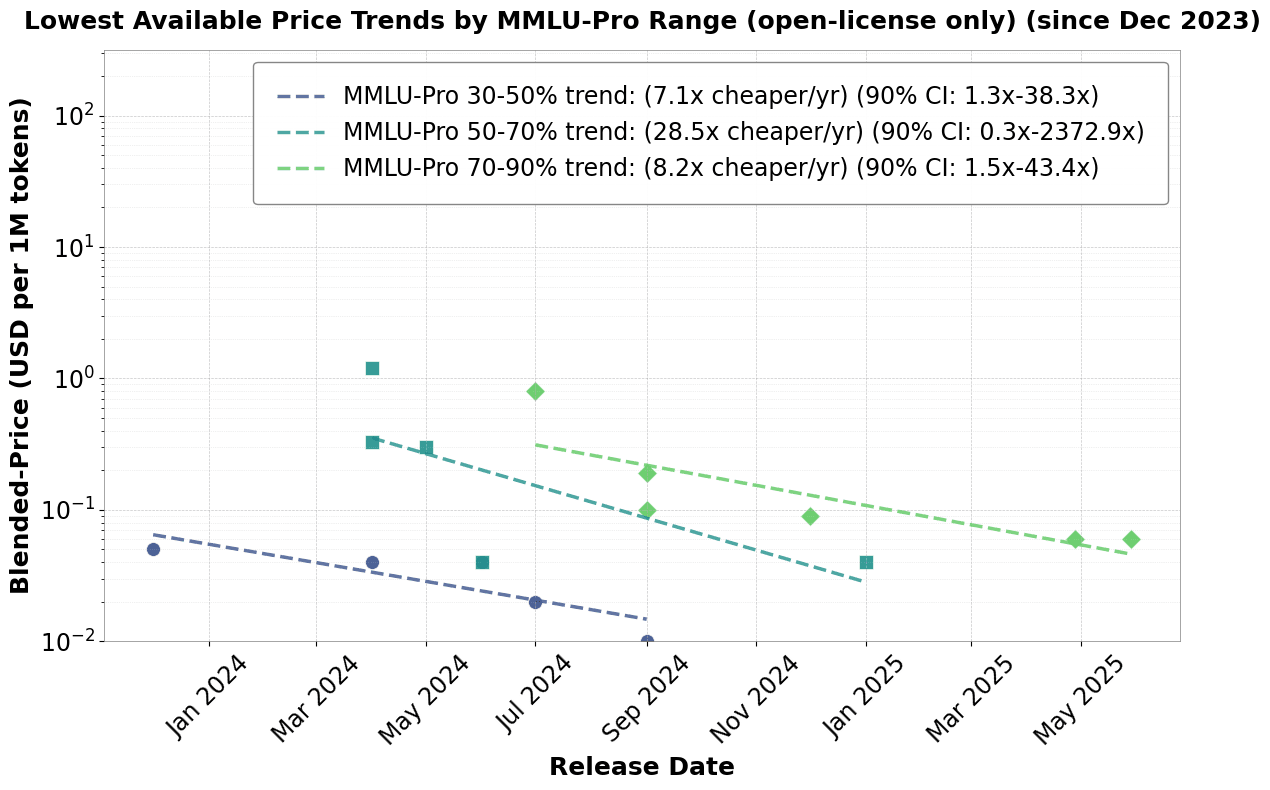
Fig 2: Trend in open-license model prices. These have significantly smaller decreases and more homogeneous trends across model quality compared to the trends for models regardless of license (see Fig 1). Data taken from Artificial Analysis.
Epoch AI has shown that decreases in inference prices have been between 10x (at low quality levels) and 1000x per year (at higher quality levels), depending on the level of model benchmark scores. Andreessen Horowitz did a similar analysis using proprietary and open source models and found inference prices decreased by a factor of 10 each year for models with MMLU score > 43. Both of these approaches used a mix of proprietary and open-source models. These general trends are important. However, these price decreases may not reflect genuine technical progress but instead represent increased market competition. Distinguishing these two factors is important because price reductions to market competition will cease once the competitive price is reached, whereas the pace of innovation could plausibly continue for longer.
Ideally, if we want to know how much cheaper inference is to frontier AI labs, we have to isolate out the technical rather than the market component. To do this, we focus on trends in open source models (using Artificial Analysis data). Open source models can theoretically be run by anyone and therefore we expect that they will not be priced at a large markup over the marginal cost to the supplier. For any given open source model, we use the lowest inference price available across all recorded providers. This is for a number of reasons. In general, even for open-source models, we notice significant price variation. First, open-source model creators often offer inference prices significantly higher than other providers like Cerebras or DeepInfra. This is possibly due to a better reputation for running models that they themselves trained and possible disinterest in consumer use. Second, LLM providers have to trade off latency and price. By focusing on the lowest prices, we hope to not confuse our trend based on model providers who have different preferences for price vs latency.
Inference costs vary for input and output tokens. We choose the 3:1 blended price, i.e., 3 input tokens for every output token, as that is the standard on Artificial Analysis and captures trends in both prices (see method 2 for trends in input vs output).
In addition, Artificial Analysis data represents the current price to run models, not the price needed to run models when they were first introduced. Therefore, our estimates better represent genuine algorithmic progress instead of hardware or datacenter efficiency progress than using historical sources, since all providers use current hardware and datacenters. We want to mention that under our analysis, algorithmic innovations can include innovations that do not strictly save FLOPS, for instance, quantization, and better scheduling procedures. Further, large model providers may have inference economies of scale, leading to lower prices not due to strictly algorithmic progress. We believe our results for open source providers are mostly not influenced by this. A certain level of inference workloads is necessary to see advantages for some algorithms, like continuous batching. However, we believe the low-price open source providers we address are not large enough to influence other factors like data center pricing.
We choose to fit a model on the lowest-available-prices/record-low-price models in three MMLU quality levels in order to capture the efficiency frontier (i.e., models that had a lower inference price than any previous model at a given quality level). This can be seen in Figures 1 and 2 for all models and open source models, respectively. Specifically, we regress the lowest blended inference price at a given MMLU-Pro level (ie, 30%-50%) by time to get a trend in each MMLU quality group. We separate the models into MMLU-Pro performance bands to control for model quality. We take the lowest prices in each band to ensure we are measuring the most efficient models. Many models may not be broadly used commercially but are present for prestige or research, or used for distillation and speculative sampling, and thus do not have model efficiency as a major objective. The trend in model prices using all models at a given quality level is significantly smaller. We do not quite know why this is the case in a competitive open-source market. Possibly this is due to the multidimensional performance of models, where an AI may have a lower MMLU-Pro score but higher coding capabilities. However, this is not a significant factor identified in our Method 2 tests.
Results:
The price of the cheapest open source models has decreased less than the trend in models overall. When we observe the inference cost trend for ALL models, we see that prices have dropped significantly more for the highest quality models than they have for the lower quality models. This is very similar to Epoch’s previous results. If we had data on models released earlier, we might see such a significant trend among lower-quality models as well that mirrors the changes in higher-quality models. For open source models, we see a relatively consistent trend ranging from 7-28x per year. This increase is relatively consistent across model quality levels, with a geometric mean of 11.8x decrease per year.
Method 2: Hedonic Regression adjusting for MMLU
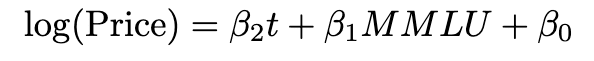
Instead of bucketing, we can adjust for MMLU-Pro by simply including it as a factor in our regression. In the non-saturated region of MMLU-Pro, we expect MMLU-Pro score to scale approximately with the logarithm of compute and therefore also with the log of parameters and price. We restrict our analysis to models with an MMLU-Pro score between 40-70 to only capture models in the non-saturated region. Finally, model capabilities generally have several somewhat independent components, i.e., reasoning, coding, and knowledge. We tried fits with more benchmarks, i.e., MMLU-Pro (Reasoning and Knowledge) and SciCode (Coding). However, these generally had lower adjusted R^2. We then run this regression on each price type.
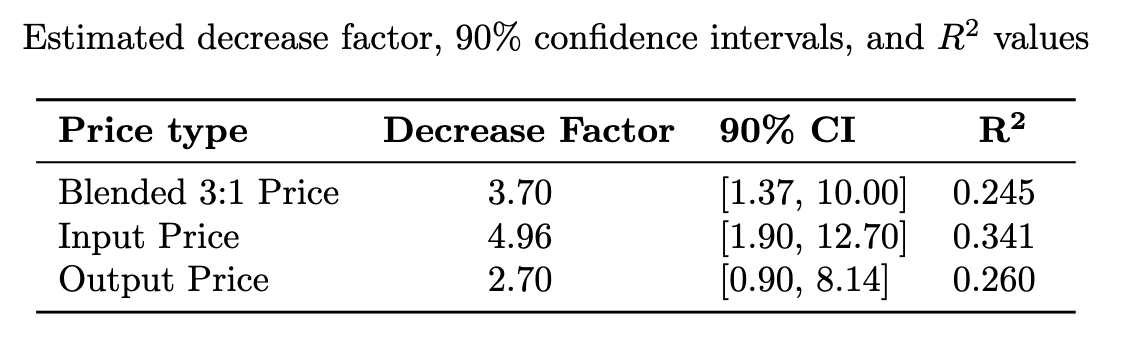
This analysis yields broadly similar algorithmic progress measures, i.e., something in the 1-10 range rather than the 10-1000 range. However, since we include all models instead of only cutting-edge ones, we find smaller but more narrow confidence intervals than Approach 1. Importantly, the trend in output token price is noticeably less than the input token price. This is significant for RL and synthetic data generation, which generally depend more on output tokens than input tokens.
What Is Causing The Trend?
The most important factor in determining the price to serve an AI model is the number of active parameters. The total number of FLOPS in a forward pass is proportional to the total number of parameters. Second, memory traffic to fetch weights from HBM (High Bandwidth Memory) is also proportional to the number of parameters N. Therefore, we divide up inference time improvements into those that decrease the number of active parameters needed at a given level of quality, as well as those that decrease the dollar cost per parameter (cost to generate 1 M tokens divided by the total parameters). These trends can be seen in Figures 3 and 4. Innovations that decrease the number of active parameters necessary at a given quality level include distillation, MoE, overtraining, better model architectures, and sparsification. The second class of innovations that decrease price at a constant level of active parameters includes KV caching, speculative sampling, group query attention, to name a few. See “A Survey on Efficient Inference for Large Language Models” for an overview of these methods.
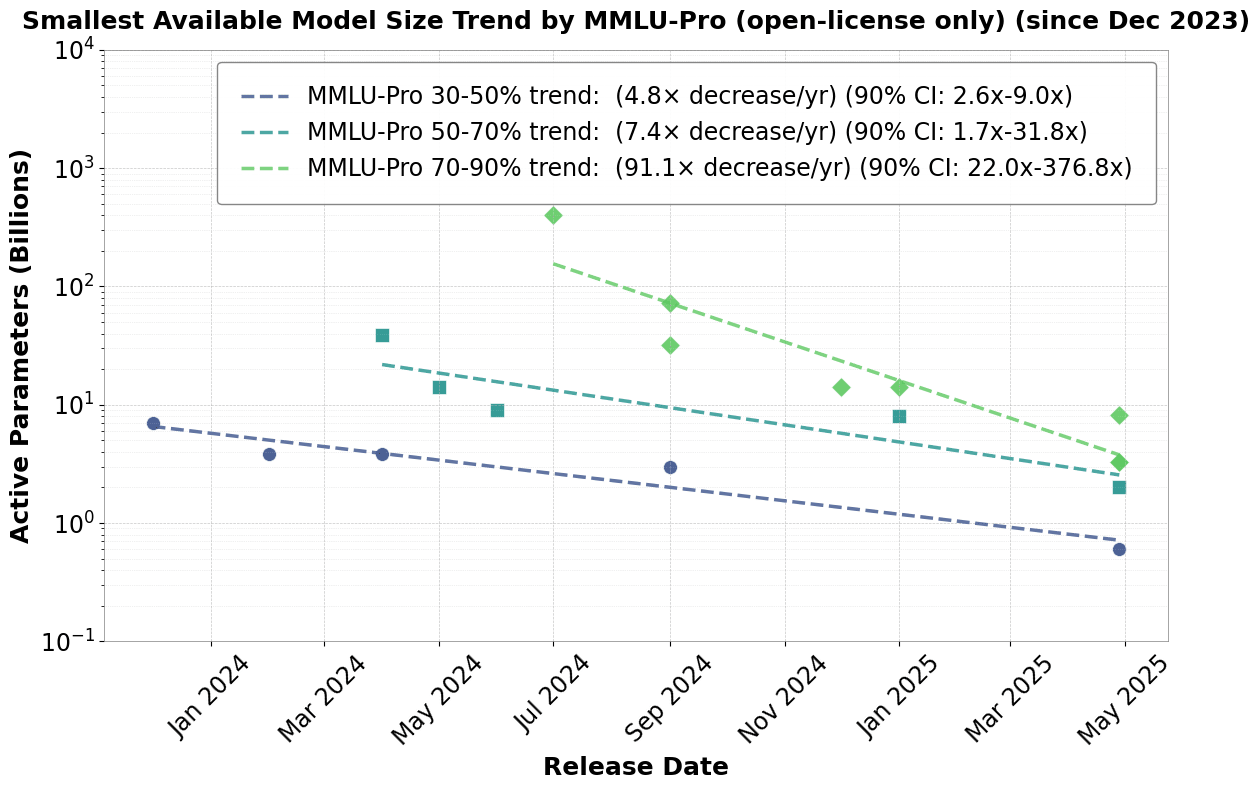
Fig 3: Trend in the lowest number of active parameters for a given MMLU-Pro quality. This is a better metric for algorithmic inference progress in terms of strict inference FLOP numbers. However, there is a large divergence between high and low quality models. Data taken from Artificial Analysis.
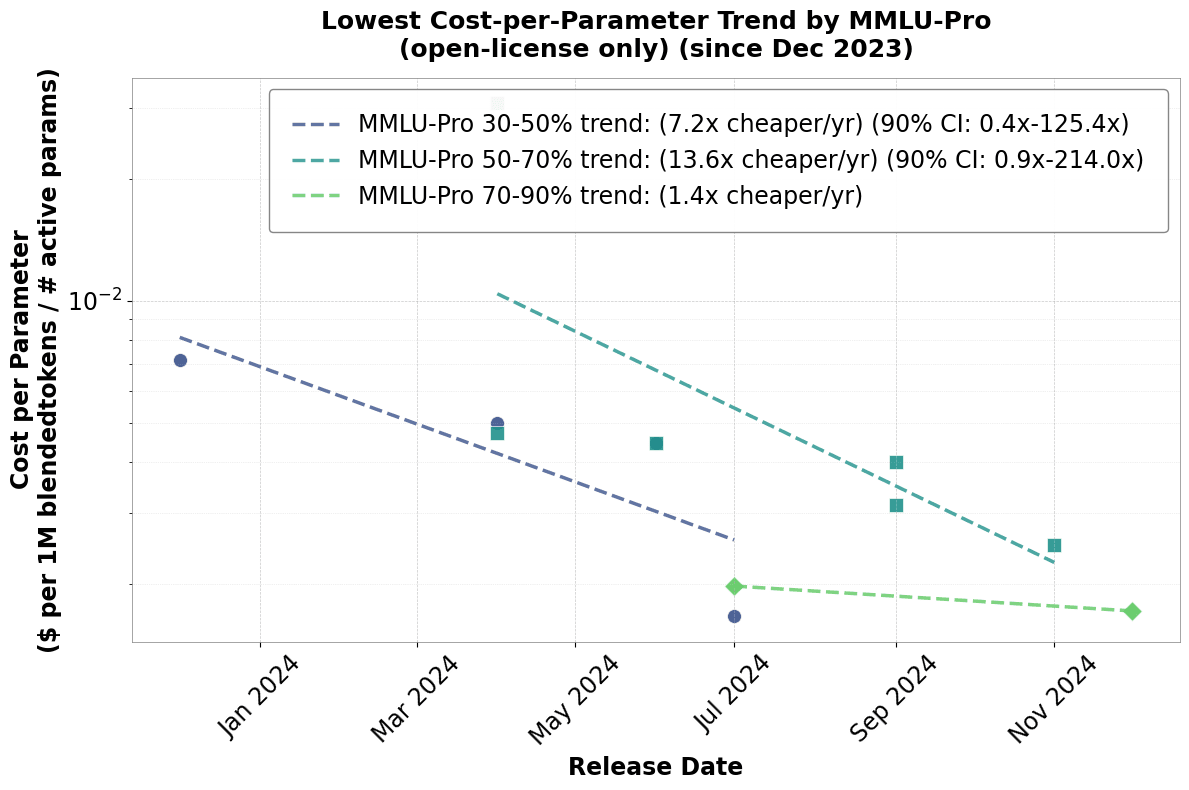
Fig 4: Trend in cost per parameter. Data taken from Artificial Analysis.
What Does This Mean For The Future of AI?
It’s hard to say how these trends will continue. We have fitted all our data to exponentials. However, it seems the trends in Fig. 1 among models overall are already starting to slow down and are now much closer to the open source trends in Fig. 2. Given the relatively small trend in cost per parameter among high-quality models compared to other model types, it looks like there is still room for improvement using conventional techniques i.e distillation, quantization, mixture of experts, etc.
There may also be entirely new types of improvements, like new non-transformer architectures, hardware, and other infrastructure for inference. Up until recently, Inference time improvements focused on low-level model and hardware integration. However, there is still plenty of room for higher-level optimization, for instance, more efficient reasoning, prompting, and scaffolding in addition to inference-optimal hardware. We may also see AI architectures more amenable to AI inference in the near future. The transformer is burned by single-token autoregressive generation with increasing marginal token cost. Other architectures like diffusion LLMs, which can generate tokens in parallel as well as recurrent networks, which take constant time to generate the next token, or a multi-token generating transformer may come to the fore. If algorithmic progress does not accelerate, it looks like an AI workforce or inference-heavy training could not expand overwhelmingly fast in the presence of investment and hardware restrictions. However, the rate of improvement while less than 1000x is still quite high. Inference improvements are as if Moore’s law happened at the scale of months rather than years.
Conclusion:
Different methods yield trends on open source models ranging from around 3-4x at the low end (regression on output and blended prices, respectively) to about 12x (geometric mean of bucketed regression) at the high end. Importantly, trends between open-source models and models overall give very different results. We believe that open-source model pricing is a better proxy for actual efficiency increases and thus previous work substantially overestimates inference efficiency gains. We believe that much of the more dramatic price reductions (100x-1000x price decreases) seen in the overall market are likely due to non-technical factors like increased market competition. Further, our analysis reveals that input token prices are decreasing almost twice as fast as output token prices. Finally, our estimates of algorithmic progress are closer to estimates of algorithmic progress in training than previous estimates.
Appendix:
Artificial analysis price data was collected in May 2025 for all models created before June. We also included newer models using July price data.
Data: https://docs.google.com/spreadsheets/d/1cGpmd1ht4R02EZLt5HRL52BqOIKqrB7r4oibwKy9Mgs/edit?usp=sharing
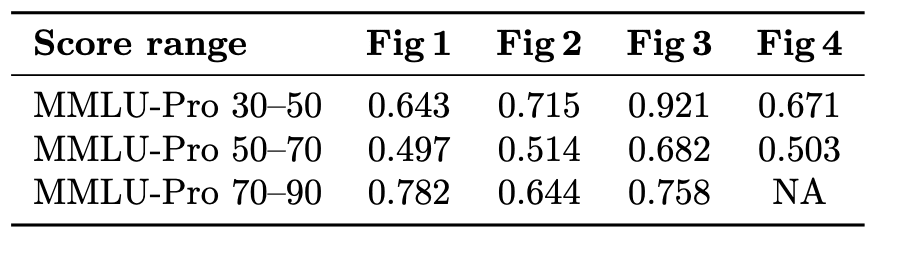
R^2 values for fits in each of the binned figures.
Discuss
