
Published on July 3, 2025 1:38 PM GMT
This is partly in response to Scott Alexander's coverage of the "new anti-hereditarians", roughly Eric Turkheimer and Sasha Gusev. My basic take is that we should focus on the effect size of genetic variation on important outcomes, rather than on heritability, an R-squared statistic which has well-known problems. Excerpts:
The R-squared is the proportion of variation in one thing explained by another. Here’s two examples using data I made up on my computer.
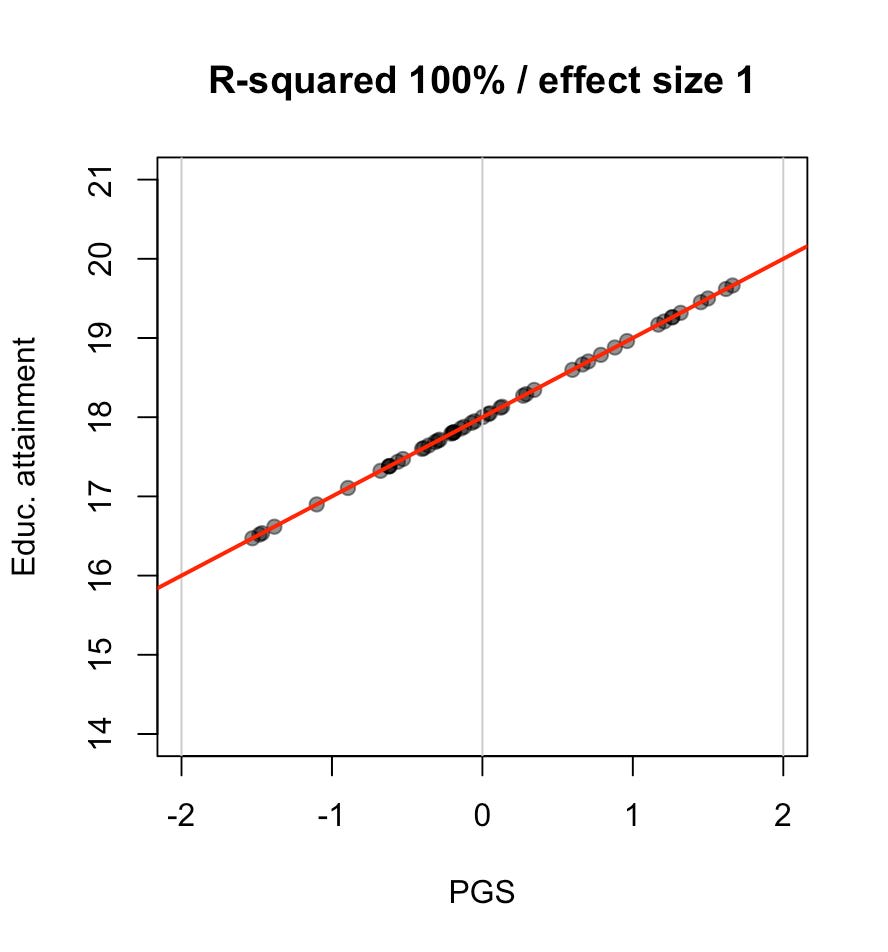
The first shows a highly unrealistic polygenic score (PGS), which perfectly explains educational attainment, measured as the age of leaving education. If you have a PGS of -2, you leave school at 16. If you have a PGS of 2 you leave school at 20. A person’s educational attainment is always exactly his polygenic score plus 18, with no environmental variation at all. The R-squared of the PGS is 100 per cent: it explains all the variation in educational attainment. The black dots show fifty people’s PGS and educational attainment; every single dot fits exactly on the red regression line, which shows the relationship between the PGS and education.
Now here’s a slightly less unrealistic polygenic score. This PGS is not so good at explaining people’s educational attainment: some of the people are above or below the red line. The R-squared is only 25%; three quarters of the variation in educational attainment is down to “the environment” (whatever that means — more on this later).
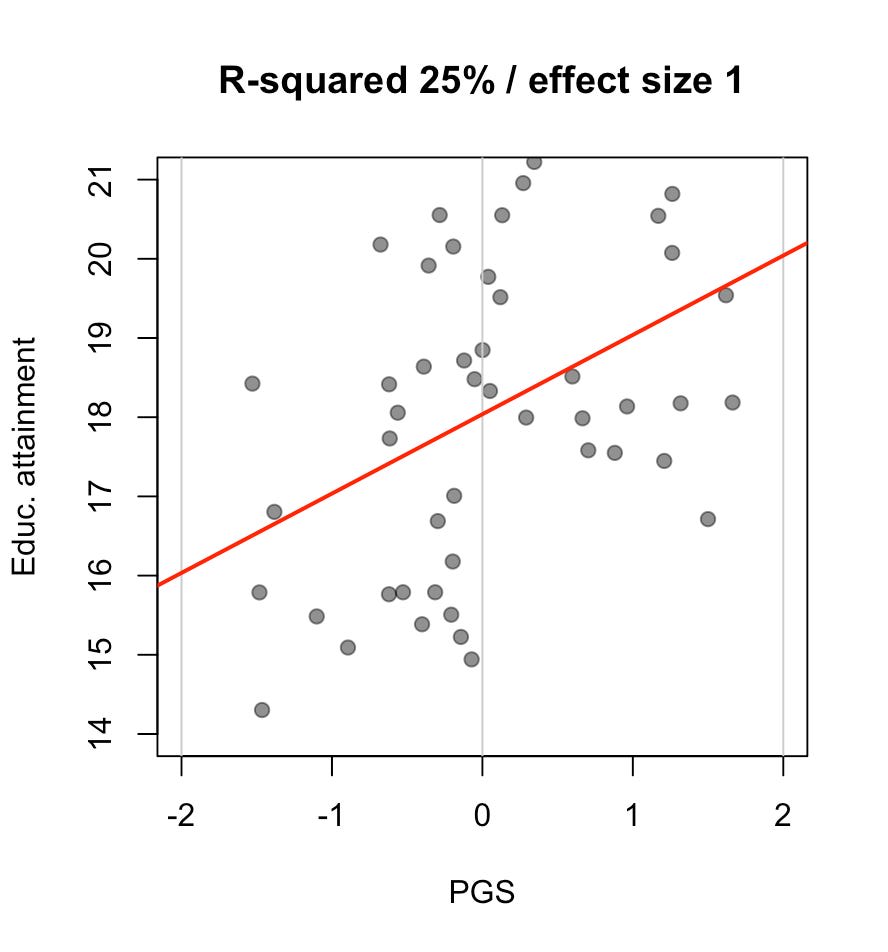
So, this polygenic score is a lot worse than the other one in terms of predicting education.
But if you look at the slope of the red line, there’s a surprise: it is exactly the same in both pictures. For both of these polygenic scores, if you score -2 you leave education at 16 on average, and if you score 2 you leave at 20 on average. There is a lot more random variation in the second picture, but the average effect of the polygenic score is the same.
In other words, the size of a variable’s effect is unrelated to the amount of variation it explains. This is not news to statisticians....
Now let’s see some real data, from our trading genetics paper (simply because I have it to hand).
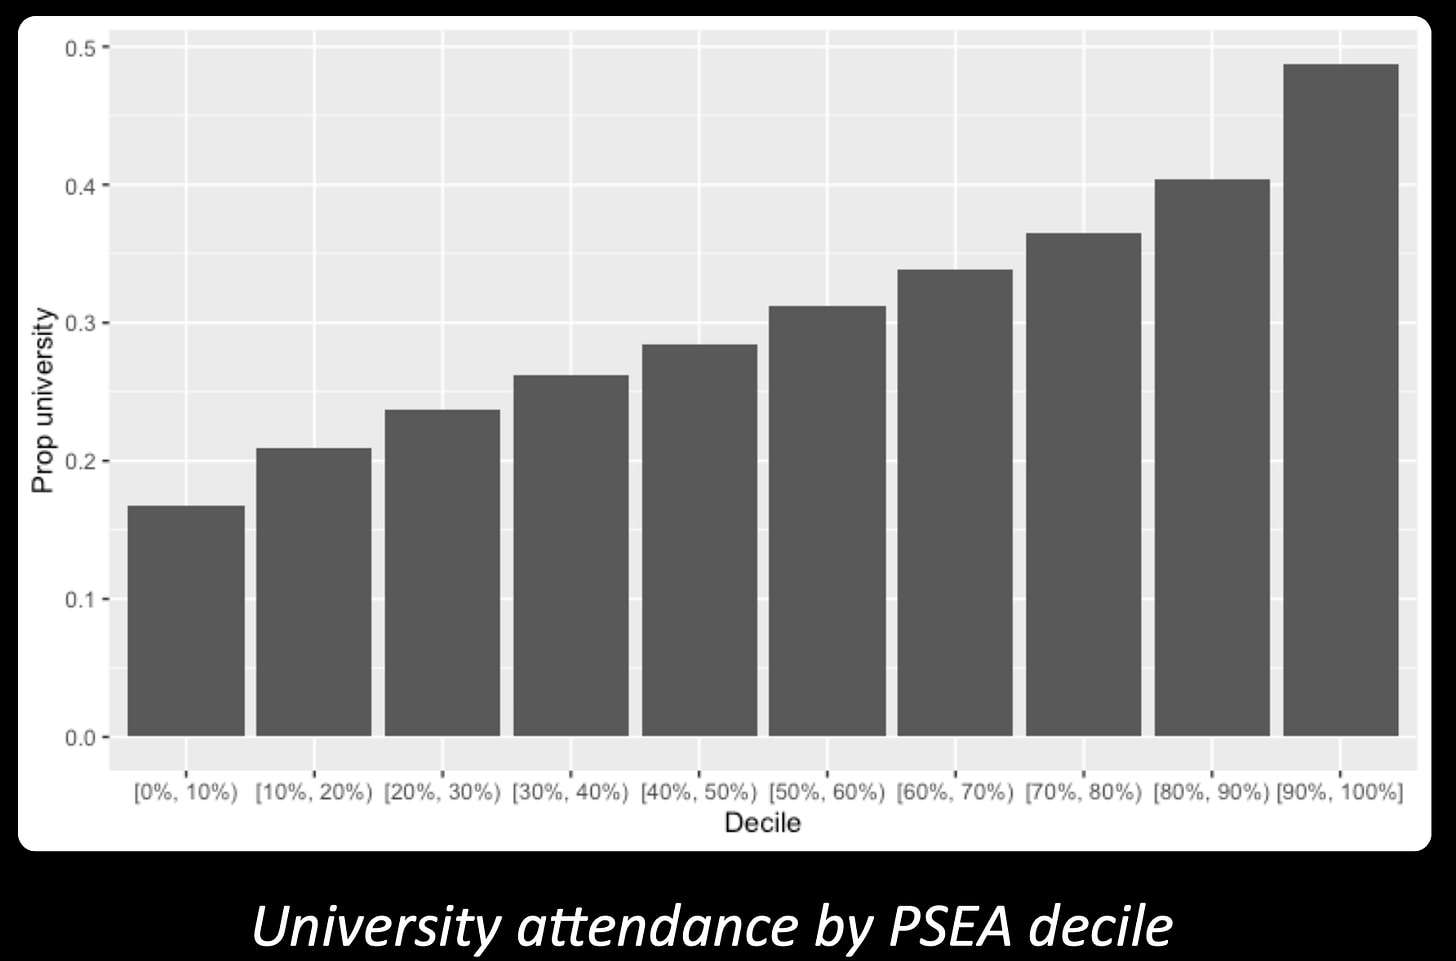
Here we’ve divided the sample up by deciles of the polygenic score for educational attainment, and simply plotted the proportion of each decile that went to university.
Less than 20% of the bottom decile went to university. Almost 50% of the top decile did. These differences are huge.
Polygenic score skeptics will correctly point out that not all of the difference is caused by the polygenic score! People with different PGS have parents with different PGS, live in different neighbourhoods, and have many other aspects of their environment that correlate with their PGS. This is true and very important to understand, and the work done recently to separate out causal effects from correlated noise is also very important.
We can measure the true effect of this PGS by looking at pairs of siblings. Because people’s genes are randomly allocated from their parents’ genes, differences between siblings are a true natural experiment. That doesn’t mean that siblings with different PGS won’t have different environments. They will! But any systematic differences in their environments will be — must be — caused by their genetics, interacting with their parents, their school environment, et cetera. Between siblings, the genetic differences come first in the causal chain.
When we do this in our sample, about half the effect of the PGS goes away. That’s pretty typical, and roughly fits the discovery that half of the differences in individual PGS’s are themselves capturing things about the shared environment.
The remaining effect is the true causal effect of the PGS. It’s now smaller, but is it small?...
Discuss
