
Artificial intelligence (AI) has enabled remarkable breakthroughs in numerous areas of critical importance, including tackling global challenges such as climate change. On the other hand, many AI models, especially large generative ones like GPT-4, are trained and deployed on energy-hungry servers in warehouse-scale datacenters, accelerating the datacenter energy consumption at an unprecedented rate.25 As a result, AI’s carbon footprint has been undergoing scrutiny, driving the recent progress in AI carbon efficiency.24,31 However, AI’s water footprint—many millions of liters of freshwater consumed for cooling the servers and for electricity generation—has largely remained under the radar and keeps escalating. If not properly addressed, AI’s water footprint can potentially become a major roadblock to sustainability and create social conflicts, as freshwater resources suitable for human use are extremely limited and unevenly distributed.
As acknowledged in Google’s sustainability report9 and the recent U.S. datacenter energy report,25 the expansion of AI products and services is a key driver of the rapid increase in datacenter water consumption. Even excluding the water usage in leased third-party colocation facilities, one technology company’s self-owned datacenters alone directly withdrew 29 billion liters and consumed (that is, evaporated) more than 23 billion liters of freshwater for onsite cooling in 2023, nearly 80% of which was potable water.9,a This amount of annual water consumption even rivals that of a major household-name beverage company.21 Importantly, the company’s datacenter water consumption increased by 20% from 2021 to 2022 and by 17% from 2022 to 2023,9 and another technology company’s datacenter water consumption saw 34% and 22% increases over the same periods, respectively.18 Furthermore, according to the recent U.S. datacenter energy report, the total annual onsite water consumption by U.S. datacenters in 2028 could double or even quadruple the 2023 level, reaching approximately 150–280 billion liters and further stressing the water infrastructures.25
AI represents the fastest-expanding workloads in datacenters.9,25 For example, a recent study suggests that the global AI could consume 85-to-134 TWh of electricity in 2027,6 whereas a more aggressive projection by the recent U.S. datacenter energy report predicts that AI servers’ electricity consumption in the U.S. alone will surpass 150-to-300 TWh in 2028.25 Even considering the lower estimate, the combined scope-1 and scope-2 water withdrawal of global AI is projected to reach 4.2-to-6.6 billion cubic meters in 2027, which is more than the total annual water withdrawal of four to six Denmarks or half of the U.K.b Simultaneously, a total of 0.38-to-0.60 billion cubic meters of water will be evaporated and considered “consumption” due to the global AI demand in 2027. Moreover, these global estimates will be exceeded by the total water withdrawal and consumption attributed to AI in the U.S. alone in 2028 if the projection in Shehabi et al.25 comes to fruition.
Despite its profound environmental and societal impact, the increasing water footprint of AI has received disproportionately less attention from the AI community as well as the general public. For example, while scope-2 carbon emissions are routinely included as part of AI model cards, even scope-1 direct water usage (either withdrawal or consumption) is missing, let alone scope-2 water usage. This may impede innovations to enable water sustainability and build truly sustainable AI. Crucially, water and carbon footprints are complementary to, not substitutable of, each other for understanding the environmental impacts. Indeed, optimizing for carbon efficiency does not necessarily result in, and may even worsen, water efficiency, which varies with the fuel mixes for electricity generation and outside weather in a unique way.10,25
To ensure that the growth in AI does not exacerbate the global water stresses or outweigh the environmental benefits it provides, it is a critical time to uncover and address AI’s hidden water footprint amid the increasingly severe freshwater scarcity crisis, worsened extended droughts, and quickly aging public water infrastructure. The urgency can also be reflected in part by the recent commitment to “Water Positive by 2030” from industry leaders, including Google9 and Microsoft,18 and by the inclusion of water footprint as a key metric into the world’s first international standard on sustainable AI to be published by the ISO/IEC.19
In this article, we advocate for a holistic approach to sustainable AI that extends beyond the carbon footprint to also address the water footprint. Specifically, we present a principled methodology to estimate AI’s total water footprint, including both operational water and embodied water. By taking the GPT-3 model with 175 billion parameters as an example,4 we show that training GPT-3 in Microsoft’s U.S. datacenters can consume a total of 5.4 million liters of water, including 700,000 liters of scope-1 onsite water consumption. Additionally, GPT-3 needs to “drink” (that is, consume) a 500ml bottle of water for roughly 10–50 medium-length responses, depending on when and where it is deployed.
Next, we show that water usage effectiveness (WUE), a measure of water efficiency, varies both spatially and temporally, suggesting that judiciously deciding when and where to train a large AI model can significantly cut the water footprint. We also emphasize the need for increasing transparency of AI’s water footprint, including disclosing more information about operational data and keeping users informed of the runtime water efficiency. Finally, we highlight the necessity of holistically addressing water footprint along with carbon footprint to enable truly sustainable AI—the water footprint of AI can no longer stay under the radar.
Background
Water withdrawal versus water consumption. There are two related but different concepts: water withdrawal and water consumption, both of which are important for understanding the impacts on water stress and availability.13,22
Water withdrawal refers to freshwater taken from the ground or surface water sources, either temporarily or permanently, and then used for agricultural, industrial, or municipal uses (normally excluding water used for hydroelectricity generation).22 As water is a finite shared resource, water withdrawal indicates the level of competition as well as dependence on water resources among different sectors.
Water consumption is defined as “water withdrawal minus water discharge”; it refers to the amount of water “evaporated, transpired, incorporated into products or crops, or otherwise removed from the immediate water environment”.13 Water consumption reflects the impact on downstream water availability and is crucial for assessing watershed-level scarcity.22
These two types of water usage correspond to two different water footprints, that is, water withdrawal footprint (WWF)5,23 and water consumption footprint (WCF), respectively.27 By default, water footprint refers to the WCF unless otherwise specified.
How does AI use water? AI’s water usage spans three scopes: onsite water for datacenter cooling (scope 1), offsite water for electricity generation (scope 2), and supply-chain water for server manufacturing (scope 3).
Scope-1 water usage. Nearly all server energy is converted into heat, which must then be removed from the datacenter server room to avoid overheating. This process involves two sequential stages: server-level cooling followed by facility-level cooling.
In the server-level cooling stage, heat is transferred from the servers to the facility or a heat exchanger, typically using either air or liquid cooling methods (for example, direct-to-chip cooling or immersion cooling), which do not evaporate or consume water. In general, new datacenters dedicated to AI training often rely on liquid cooling due to the high server power densities.
In the facility-level cooling stage, heat is rejected from the datacenter facility to the outside environment. While there are various cooling methods, water-intensive cooling towers and water evaporation-assisted air cooling are two common approaches used in many datacenters, including those operated by major technology companies.9,25
Cooling tower. As illustrated in Figure 1, some water is evaporated (that is, “consumed”) in the cooling tower to dissipate heat into the environment, while the remaining water moves along an open loop to the heat exchanger to further absorb server heat. Additionally, non-evaporated water can be recycled only a few times (typically 3–10 cycles, depending on water quality) before discharge, requiring continuous clean freshwater replenishment to prevent mineral and salt buildup. Thus, to keep the cooling tower working, new water must be constantly added to make up for the evaporated water and discharged water. Importantly, clean freshwater (potable water in many cases9) is needed to avoid pipe clogs and/or bacterial growth.

For cooling towers, water withdrawal refers to the amount of added water, including both evaporated water and discharged water, while water consumption exclusively indicates the amount of evaporated water. With good water quality, roughly 80% of water withdrawal is evaporated and considered “consumption”.9 On average, depending on the weather conditions and operational settings, datacenters can evaporate approximately 1–9L/kWh of server energy: 1L/kWh for Google’s annualized global onsite water efficiency9 and 9 L/kWh for a large commercial datacenter during the summer in Arizona.11
Air cooling with water evaporation assistance. When the climate condition is appropriate, datacenters may use “free” outside air to directly reject the heat to the outside environment. Nonetheless, water evaporation is still needed when the outside air is too hot (for example, higher than 85°F); additionally, water is also needed for humidity control when the outside air is too dry.14 The added water is considered “withdrawal,” out of which about 70% is consumed based on Meta’s report.15 Generally, outside air cooling is more water-efficient than cooling towers on average. However, hot weather raises the evaporative water demand and maximum water consumption, potentially stressing local water supplies during peak demand on hot days. Additionally, the application of outside air cooling may have challenges in hot regions and/or for many colocation facilities located in business districts.
Some datacenters may opt for dry coolers, which consume no onsite water year-round.29 However, this approach typically increases cooling energy consumption compared to water-based cooling methods, potentially exacerbating the overall stress on water resources due to higher scope-2 water consumption.
Scope-2 water usage. In many countries, thermoelectric power is among the top sectors in terms of water withdrawal and water consumption.23 Thus, similarly to scope-2 carbon emissions, datacenters are accountable for off-site scope-2 water usage associated with electricity consumption, which forms part of the “true water cost of datacenters,” as highlighted by the recent U.S. datacenter energy report.25
Different power plants use different amounts of water for each kWh generation, depending on the cooling techniques. Typically, water withdrawal due to hydropower generation is excluded, but water consumption due to increased water evaporation rates from hydropower generation is included.25 For electricity generation, the U.S. national average water withdrawal and consumption are estimated at about 43.8L/kWh32 and 3.1L/kWh,23 respectively. Meta’s self-reported scope-2 water consumption for its global datacenter fleet was 3.7L/kWh (that is, 55,475 megaliters divided by 14,975,435MWh) in 2023.15
Scope-3 water usage. AI chip and server manufacturing uses a huge amount of water.7,28 For example, ultrapure water is needed for wafer fabrication and water is also needed for keeping semiconductor plants cool. Importantly, the discharged water may contain toxic chemicals and/or hazardous wastes. While water recycling at semiconductor plants can effectively reduce water withdrawal, the recycling rate in many cases remains low, for example, the average recycling rates for wafer plants and semiconductor plants in Singapore are 45% and 27%, respectively.28 Although largely obscure, scope-3 water usage is likely significant.7 For instance, Apple reports that its supply chain accounts for 99% of its total water footprint.2
It is important to recognize that unlike agriculture, whose water footprint is mostly green (that is, water stored in soil and used by plants), the majority of AI’s water footprint is blue water extracted from rivers, lakes, or groundwater, which is directly accessible for human use but often more limited in availability.
Estimating AI’s Water Footprint
We present a general methodology for estimating AI’s water consumption footprint. To obtain the water withdrawal footprint, we simply replace the WUE with water withdrawal efficiency.
Operational water footprint. We collectively refer to onsite scope-1 water and off-site scope-2 water as the operational water.
Onsite WUE. We denote the onsite scope-1 WUE at time by , which is defined as the ratio of the onsite water consumption to server energy consumption and varies over time depending on the outside temperature (see Islam et al.10 for an example of onsite WUE based on cooling towers). Concretely, increases significantly for cooling towers when the outside wet bulb temperature increases, and increases for outside air cooling when the outside dry bulb temperature is too hot or the humidity is too low.
Offsite WUE. We denote the off-site scope-2 WUE at time as , which is defined as the ratio of offsite water consumption for each kWh of electricity consumption and measures the electricity water intensity factor (EWIF). While there are different methods to estimate , a common one is weighted averaging: where denotes the amount of electricity generated from fuel type at time for the grid serving the datacenter under consideration, and is the EWIF for fuel type .1,8 Thus, variations in energy fuel mixes of electricity generation result in temporal variations of the off-site WUE. Moreover, the offsite WUE also varies across regions due to different energy fuel mixes.23,25
Operational water footprint. Consider a time-slotted model , where the length of each time slot depends on how frequently we want to assess the operational water footprint. At time , suppose that an AI model uses energy which can be measured using power meters and/or servers’ built-in tools, and the datacenter hosting the AI model has a power usage effectiveness (PUE) of that accounts for the non-IT energy overhead. Then, the total operational water footprint of the AI model can be written as .
Embodied water footprint. Similar to accounting for the embodied carbon footprint,12 the total scope-3 water footprint is amortized over the lifespan of a server. Specifically, if represents the total water used to manufacture the AI servers and the servers are expected to operate for a period of , then the embodied water footprint over a period of is calculated as
By adding the operational and embodied water footprints, we obtain the total water footprint as . In practice, to obtain a rough estimate, we can use the average values for the annualized WUE and the estimated AI server energy consumption.
Case Study: Estimating GPT-3’s operational water consumption footprint. The core of ChatGPT, a popular online service, is a large language model (LLM) based on subsequent versions of GPT-3. We present a case study to estimate the operational water consumption for the full GPT-3 model with 175 billion parameters.4 We exclude embodied water footprint due to the lack of public data for scope-3 water usage. We choose GPT-3, as Microsoft publishes its location-wise WUE and PUE.16,17 The results are summarized in Table 1.
| Location | PUE | Onsite WUE (L/kWh) | Offsite EWIF (L/kWh) | Water for Training (million L) | Water for Each Request (mL) | # of Requests for 500ml Water | ||||
|---|---|---|---|---|---|---|---|---|---|---|
| Onsite Water | Offsite Water | Total Water | Onsite Water | Offsite Water | Total Water | |||||
| U.S. Average | 1.170 | 0.550 | 3.142 | 0.708 | 4.731 | 5.439 | 2.200 | 14.704 | 16.904 | 29.6 |
| Arizona | 1.180 | 1.630 | 4.959 | 2.098 | 7.531 | 9.629 | 6.520 | 23.406 | 29.926 | 16.7 |
| Georgia* | 1.120 | 0.060 | 2.309 | 0.077 | 3.328 | 3.406 | 0.240 | 10.345 | 10.585 | 47.2 |
| Illinois | 1.350 | 0.740 | 2.233 | 0.952 | 3.880 | 4.833 | 2.960 | 12.060 | 15.020 | 33.3 |
| Iowa | 1.160 | 0.140 | 3.104 | 0.180 | 4.634 | 4.814 | 0.560 | 14.403 | 14.963 | 33.4 |
| Texas | 1.280 | 0.250 | 1.287 | 0.322 | 2.120 | 2.442 | 1.000 | 6.590 | 7.590 | 65.9 |
| Virginia | 1.140 | 0.140 | 2.385 | 0.180 | 3.499 | 3.679 | 0.560 | 10.875 | 11.435 | 43.7 |
| Washington | 1.150 | 0.950 | 9.501 | 1.223 | 14.063 | 15.285 | 3.800 | 43.706 | 47.506 | 10.5 |
| Wyoming | 1.110 | 0.130 | 2.574 | 0.167 | 3.677 | 3.845 | 0.520 | 11.429 | 11.949 | 41.8 |
| Australia* | 1.120 | 0.012 | 4.259 | 0.015 | 6.138 | 6.154 | 0.048 | 19.078 | 19.126 | 26.1 |
| Denmark* | 1.160 | 0.010 | 3.180 | 0.013 | 4.747 | 4.760 | 0.040 | 14.754 | 14.794 | 33.8 |
| Finland* | 1.120 | 0.010 | 4.542 | 0.013 | 6.548 | 6.561 | 0.040 | 20.350 | 20.390 | 24.5 |
| India* | 1.430 | 0.000 | 3.445 | 0.000 | 6.340 | 6.340 | 0.000 | 19.704 | 19.704 | 25.4 |
| Indonesia* | 1.320 | 1.900 | 2.271 | 2.445 | 3.858 | 6.304 | 7.600 | 11.992 | 19.592 | 25.5 |
| Ireland | 1.190 | 0.020 | 1.476 | 0.026 | 2.261 | 2.287 | 0.080 | 7.027 | 7.107 | 70.4 |
| Mexico* | 1.120 | 0.056 | 5.300 | 0.072 | 7.639 | 7.711 | 0.224 | 23.742 | 23.966 | 20.9 |
| Netherlands | 1.140 | 0.060 | 3.445 | 0.077 | 5.054 | 5.131 | 0.240 | 15.708 | 15.948 | 31.4 |
| Sweden | 1.160 | 0.090 | 6.019 | 0.116 | 8.986 | 9.101 | 0.360 | 27.927 | 28.287 | 17.7 |
Training. GPT-3 was trained and deployed by OpenAI in Microsoft’s datacenters, with an estimated training energy of 1287MWh.20 In line with the practice of estimating the carbon footprint, we use the most recent annualized average onsite PUE and WUE for each location, as reported by Microsoft.16,17 For power plant water efficiency, different references may provide different estimates of EWIF. Thus, for consistency across regions, we use the EWIF provided by Reig et al.23 to estimate scope-2 water consumption, as it employs the same methodology for calculating EWIF. Moreover, a large number of Microsoft’s datacenters are located in the U.S., where the average EWIF provided by Reig et al.23 is 3.14L/kWh and significantly lower than 4.35L/kWh noted by the recent report.25 The specific location for training GPT-3 is not public. Thus, we consider Microsoft’s different datacenter locations, while excluding Singapore and Taiwan, as EWIF data for these regions is not available in Reig et al.23
Inference. As a representative usage scenario for an LLM, we consider a conversation task, which typically includes a CPU-intensive prompt phase that processes user input (also known as prompt) and a memory-intensive token phase that produces outputs.30 More specifically, we consider a medium-sized request, each with approximately 800 words of input and 150–300 words of output.30 The official estimate indicates that GPT-3 consumes an order of 0.4kWh of electricity to generate 100 pages of content, equivalent to roughly 0.004kWh per page.4 While no details are provided, the estimate likely considers only the GPU energy used during token generation. To account for both the prompt phase and the non-GPU energy consumption of servers, we assume a per-request server energy consumption of 0.004kWh for our conversation task. The PUE, WUE, and EWIF are the same as those used for estimating the training water consumption.
Our estimate of inference water consumption for GPT-3 is on the conservative side, and the actual water consumption could be several times higher. Specifically, when considering service-level objectives (SLOs) for LLM response times in enterprise-grade Nvidia DGX H100 systems for conversation tasks, the server-level inference energy consumption for a much smaller model (for example, Llama-3-70B) is already approximately 0.010kWh per medium-sized request when using a state-of-the-art LLM inference solution and accounting for non-GPU server overhead.30 For the Falcon-180B model, which is comparable in size to GPT-3-175B, the server-level energy consumption reaches approximately 0.016kWh per medium-sized request.30 Furthermore, we emphasize that Microsoft’s datacenters already have some of the lowest onsite WUE in the industry. If the same model is deployed in a third-party colocation datacenter, the scope-1 direct water consumption may be several times higher. Additionally, our EWIF for the U.S. (3.14L/kWh) is conservative and significantly lower than the recently reported 4.35 L/kWh.25
While no official information is available on the resource consumption, some subsequent models like GPT-4 could consume substantially more energy and water than GPT-3 for processing the same request, especially under the reasoning mode.3,26 With continued efforts to reduce AI’s computational demand and improve overall water efficiency, the water consumption per request may decrease in the future. However, the total water consumption is likely to continue rising due to the growing demand for AI services and the increasing scale of AI applications.25
Our Recommendations
We provide our recommendations to address AI’s water footprint from scheduling and policy perspectives, making future AI more environmentally sustainable.
More transparency and comprehensive reporting. Despite its growing importance, AI’s water footprint has received relatively less attention. For example, while AI model cards routinely include carbon emissions and serve as an important reporting framework for understanding AI’s environmental impacts, they currently omit information on AI’s water consumption. The lack of transparency may obstruct efforts to drive innovations that enhance water sustainability and support truly sustainable AI. As an initial step to raise awareness among end users about the water resource impacts of their AI usage, we recommend tracking and reporting AI’s water consumption in AI model cards and/or through cloud dashboards.
Moreover, a comprehensive understanding and reporting of AI’s scope-2 water consumption associated with electricity generation remain limited. Although datacenters have increasingly adopted climate-conscious cooling system designs to minimize onsite water consumption,9,14,29 these efforts primarily focus on scope-1 water usage while largely overlooking scope-2 impacts. Just as addressing scope-2 carbon emissions is important for mitigating climate change, it is equally crucial to address scope-2 water consumption to reduce AI’s “true water cost,” as noted by the recent U.S. datacenter energy report.25 To better reflect the true impacts of datacenters on water resources, some technology companies such as Meta have begun to include scope-2 water consumption in their sustainability reports.15 We recommend the reporting of scope-2 water consumption as a standard practice. This approach makes the offsite water consumption visible to AI model developers as well as end users and can unlock new opportunities for demand-side flexibility, thereby alleviating the overall strain on water resources.
Finally, despite the enormous scope-3 supply-chain water footprint,2 there is limited data available for embodied water usage by chip manufacturing. We recommend further research on scope-3 water consumption to achieve a comprehensive understanding of AI’s overall water footprint and to foster corporate water stewardship.
‘When’ and ‘where’ matter. Judiciously deciding “when” and “where” to train a large AI model can significantly affect the water footprint. Water efficiency exhibits a spatial-temporal diversity—onsite water efficiency changes due to variations of outside weather conditions, and off-site water efficiency changes due to variations of the grid’s energy fuel mixes to meet time-varying demands (Figure 2). Therefore, we can dynamically schedule AI training and inference in a water-wise manner to cut the water footprint. For example, we may schedule AI training at midnight and/or in a datacenter with better water efficiency. Likewise, if informed of the real-time water efficiency, some water-conscious users may prefer to use AI inference during water-efficient hours and/or in water-efficient datacenters, which can reduce AI’s water footprint by enabling demand-side flexibility.
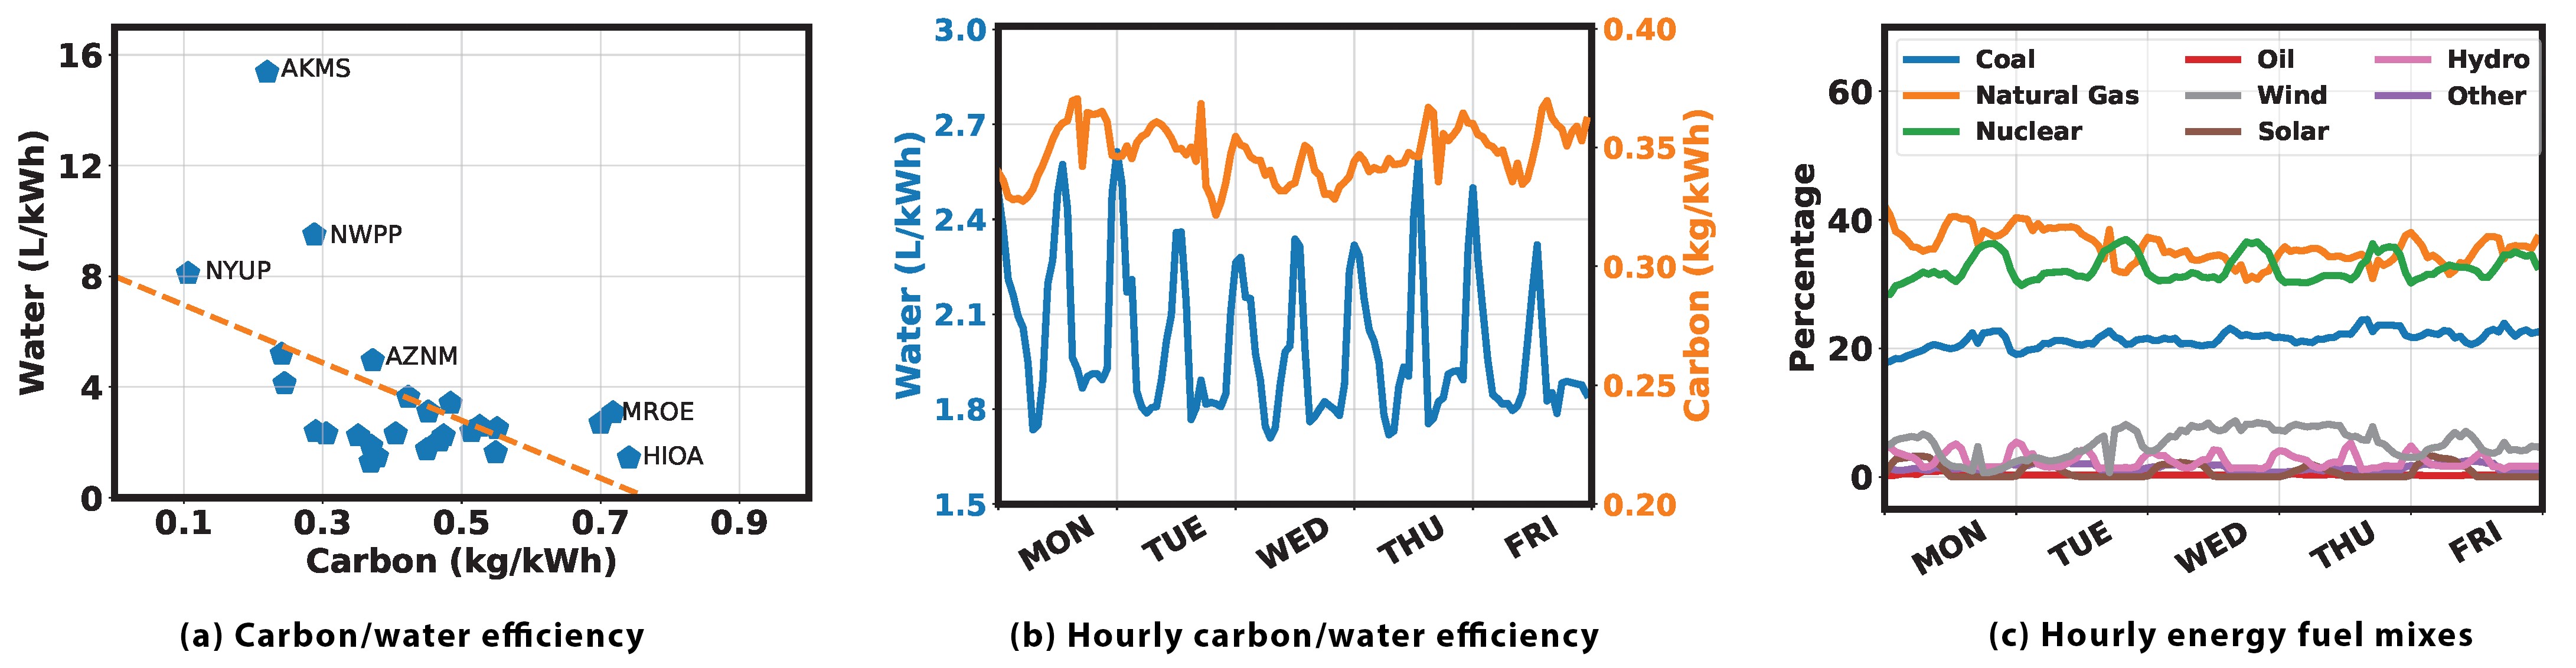
‘Follow the Sun’ or ‘Unfollow the Sun.’ To cut the carbon footprint, it is preferable to “follow the sun” when solar energy is more abundant. Nonetheless, to cut the water footprint, it may be more appealing to “unfollow the sun” to avoid high-temperature hours of a day when WUE is high. This conflict can also be shown in Figure 2a and Figure 2b, where we see misalignment between the scope-2 water consumption intensity factor and carbon emission rate: Minimizing one footprint might increase the other footprint. This observation further corroborates the previous finding that the environmental impacts of carbon and water footprints are not substitutable.10,25 Therefore, to judiciously achieve a balance between “follow the sun” for carbon efficiency and “unfollow the sun” for water efficiency, we need to reconcile the potential water-carbon conflicts by using holistic approaches that are both carbon-efficient and water-wise.
Conclusion
In this paper, we uncover AI’s water usage as a critical concern for socially responsible and environmentally sustainable AI. We present a principled methodology to estimate AI’s water footprint. Then, using GPT-3 as an example, we show that a large AI model can consume millions of liters of water for training. We also discuss that the scope-1 and scope-2 water efficiencies vary spatially and temporally—judiciously deciding “when” and “where” to run a large AI model can significantly cut the water footprint. In addition, we recommend increased transparency and comprehensive reporting of AI’s water footprint, and highlight the necessity of holistically addressing water footprint along with carbon footprint to enable truly sustainable AI.
AI’s water footprint can no longer stay under the radar and must be addressed as a priority as part of the collective efforts to combat global water challenges.
Acknowledgment
The work of Pengfei Li and Shaolei Ren was supported in part by NSF CCF-2324916. The work of Mohammad A. Islam was supported in part by NSF ECCS-2152357 and CCF-2324915.
About the Authors
Pengfei Li is a Ph.D. candidate at the University of California, Riverside, CA, USA.
Mohammad A. Islam is an assistant professor at the University of Texas, Arlington, TX, USA.
Jianyi Yang is an assistant professor at the University of Houston, TX, USA.
Shaolei Ren is an associate professor at the University of California, Riverside, CA, USA.
