
Published on March 5, 2025 2:40 AM GMT
Max Newman is a great contradance musician, probably best known for playing guitar in the Stringrays, who recently wrote apieceon dance performer pay, partly prompted by my post lastweek. I'd recommend reading it and the comments for a bunch ofinteresting discussion of the tradeoffs involved in pay.
One part that jumped out at me, though, is his third point:
3) Real World Compensation is BehindRisking some generalizing and over-simplifying, any dance performercould tell you that over the past 10 (20!) years, the compensationnumbers have been sticky, sometimes static. In real terms,compensation on the whole has not kept up with inflation.
This is quite important: if pay is decreasing in real terms then it'slikely that the dance community is partly coasting off of pastinvestment in talent and we shouldn't expect that to continue. Exceptwhen I look back over my own compensation, however, I don't see adecrease. For dance weekends, counting only weekends that includedtravel, my averages have been (in constant January 2025 dollars):
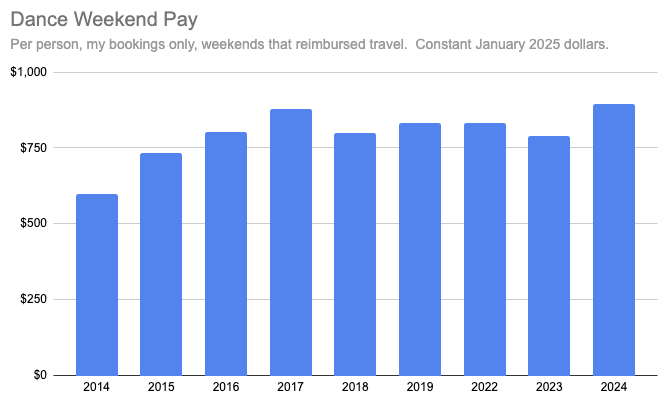
| Year | Mean | Count |
|---|---|---|
| 2014 | $600 | 2 |
| 2015 | $732 | 5 |
| 2016 | $804 | 5 |
| 2017 | $879 | 5 |
| 2018 | $798 | 3 |
| 2019 | $833 | 3 |
| 2022 | $831 | 2 |
| 2023 | $789 | 5 |
| 2024 | $893 | 3 |
I wouldn't put too much weight on the low numbers for 2014 and 2015:initially the Free Raisinsweren't too sure what the going rates were and probably ended up a biton the low side.
What about dances that aren't special events? My record keeping forevening dances isn't quite good enough to make these numbers easy topull, but I do have good data for tours:
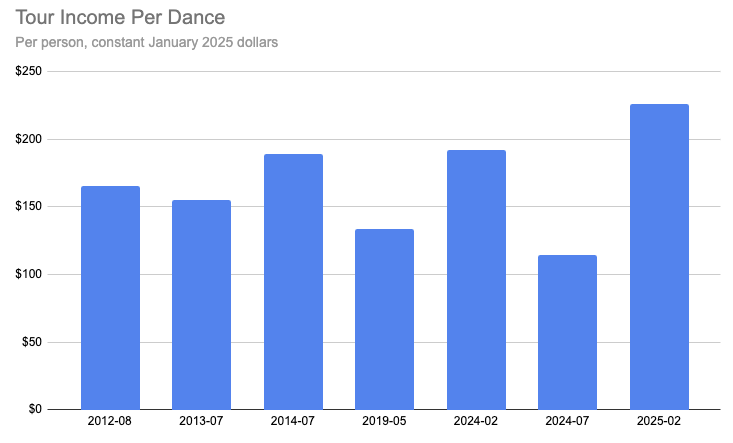
| Date | Average | Count |
| 2012-08 | $165 | 7 |
| 2013-07 | $155 | 7 |
| 2014-07 | $189 | 11 |
| 2019-05 | $134 | 6 |
| 2024-02 | $192 | 6 |
| 2024-07 | $115 | 7 |
| 2025-02 | $226 | 4 |
One thing to keep in mind is that tour payments depend on where in thecountry you're touring, and are correlated. For example the 2024-07 tour wasthrough a lower cost of living area (Rochester, Pittsburgh,Bloomington, St Louis, Cincinnati, Indianapolis) while the 2025-02tour was the opposite (Baltimore, DC, Bethlehem, NYC). But hereas well I don't see payment failing to keep up with inflation.
One more place I can look for data is what BIDA has been paying. The structure is a guarantee(the minimum performers are paid, regardless of what attendees do) andthen a potential bonus (originally a share of profits, switching to anattendancebonus in 2023). Here's what I see, but keep in mind thatthese averages exclude some dances where there's missing data:
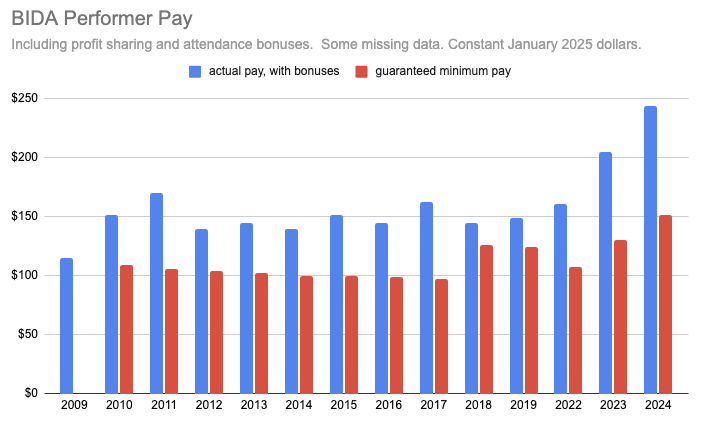
| year | actual pay, with bonuses | guaranteed minimum pay |
|---|---|---|
| 2009 | $115 | |
| 2010 | $152 | $109 |
| 2011 | $170 | $106 |
| 2012 | $140 | $104 |
| 2013 | $144 | $102 |
| 2014 | $140 | $100 |
| 2015 | $152 | $100 |
| 2016 | $145 | $99 |
| 2017 | $162 | $97 |
| 2018 | $145 | $126 |
| 2019 | $149 | $124 |
| 2022 | $161 | $107 |
| 2023 | $205 | $130 |
| 2024 | $244 | $152 |
Note again that all the dollar amounts in this post are(inflation-adjusted) January 2025 dollars.
This data isn't ideal, though, because it's telling the story of adance that has been becoming increasingly popular overtime. While I do think there's a component of higher pay leadingto being able to attract better performers, leading to higherattendance, leading to higher pay, etc, the pay increases have mostlybeen responsive: realizing that things are going well and we're ableto pay musicians more. [1]
I think what would be most illuminating here would be for performers toshare their numbers: how have you seen things change over time?
[1] I was curious how much of the increased attendance has beenswitching to bookingsome established bands, but most of the increase predates thatbooking change.
Comment via: facebook, mastodon, bluesky
Discuss
