
Published on February 3, 2025 7:36 PM GMT
Abstract
This project aims to address gaps in machine learning (ML) interpretability with regard to visualization by investigating researchers workflows, tool usage, and challenges in understanding model behavior. Through a survey and interviews with practitioners, I identified limitations in existing visualization tools, such as fragmented workflows and insufficient support for analyzing neuron-level attributions. Based on these findings, I developed a prototype tool to visualize neuron activations and attributions, enabling deeper insights into model decision-making. This work contributes to enhancing the understanding of ML models and improving their transparency, a critical step toward ensuring the safety and reliability of advanced AI systems.
Introduction
Understanding model behavior is critical for AI safety, as opaque systems risk unintended harmful outcomes. Improved interpretability tools help researchers audit models, detect biases, and verify alignment with intended goals. Existing tools like TensorBoard, SHAP, LIME, and Captum provide partial solutions but focus on specific tasks (e.g., feature importance). Studies (Lipton 2018; Samek et al. 2021) highlight the need for integrated, neuron-level analysis. However, no tool combines attribution mapping with activation visualization in a unified workflow, a gap our work targets.
Methods
Survey
Through a short survey to distributed to ML researchers, I was able to gain insight on the tools they used such as Transformer Lens and CircuitsVis, workflow pain points, and desired features like the ability to visualize finer-grained explanation only for specific units of interest among other inquiries.
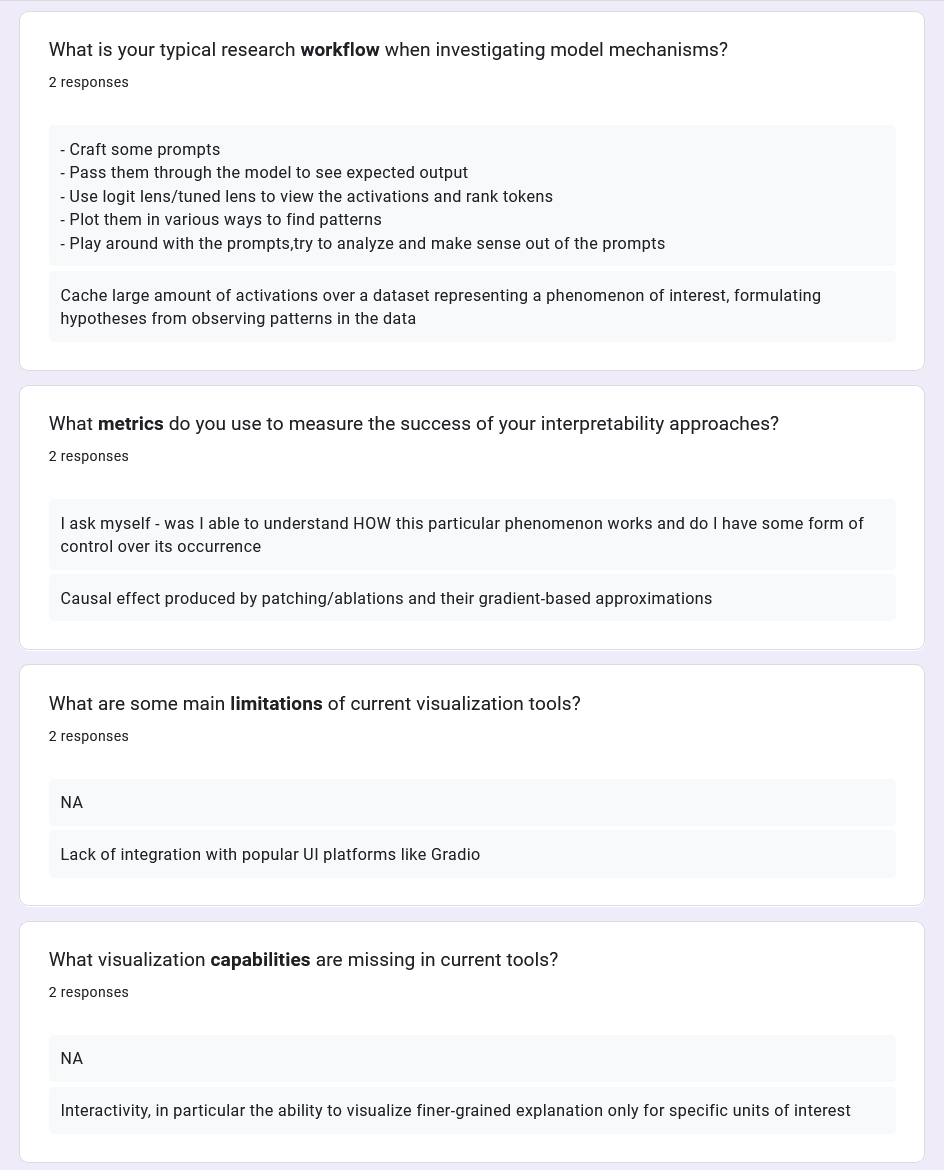
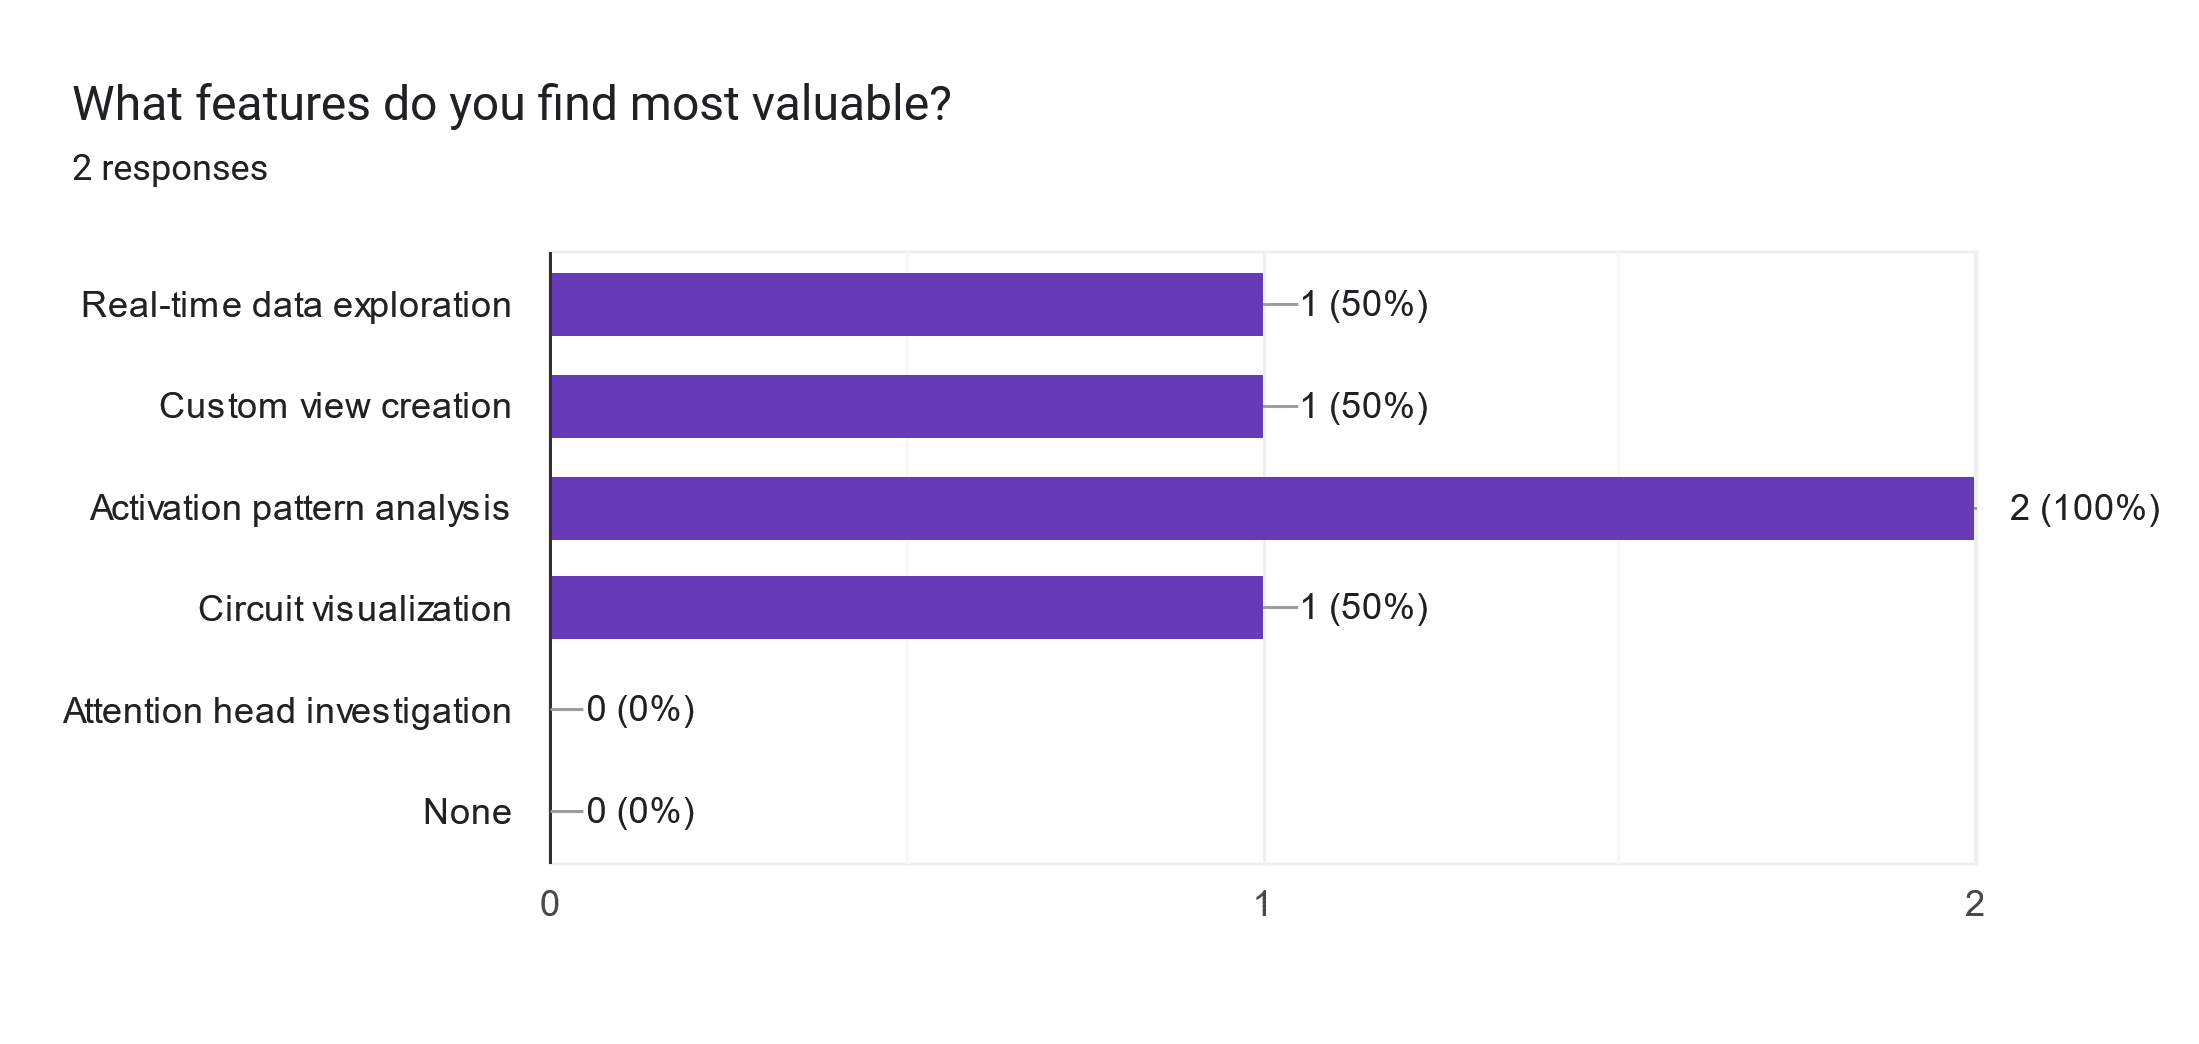
I then analyzed responses quantitatively (usage frequency) and qualitatively (open-ended feedback). Among valuable features in existing tools, Activation Pattern analysis stood out as quite significant.
Interview
Following the surveys, I conducted a semi-structured interview with Harvard PhD candidate and researcher Shivam Raval about specializing in neural network interpretability. Topics included methods for visually analyzing neuron behavior, activation maximization and the current challenges in attributing model decisions to specific neurons.
We discussed the effectiveness of various visualization tools, emphasizing the importance of interactive visualizations in research for hypothesis formation and validation. Shivam expressed concerns that researchers might be reluctant to explore new tools, which could hinder innovation. He shared his approach to visualization, focusing on design and scaling insights, while also highlighting the need for tools that enhance the research experience. The conversation shifted to model feature analysis techniques, where Shivam explained probing and patching, along with additional methods like circuit analysis and logit lens, stressing the significance of manipulating activations to understand model behavior, especially in safety contexts.
Results
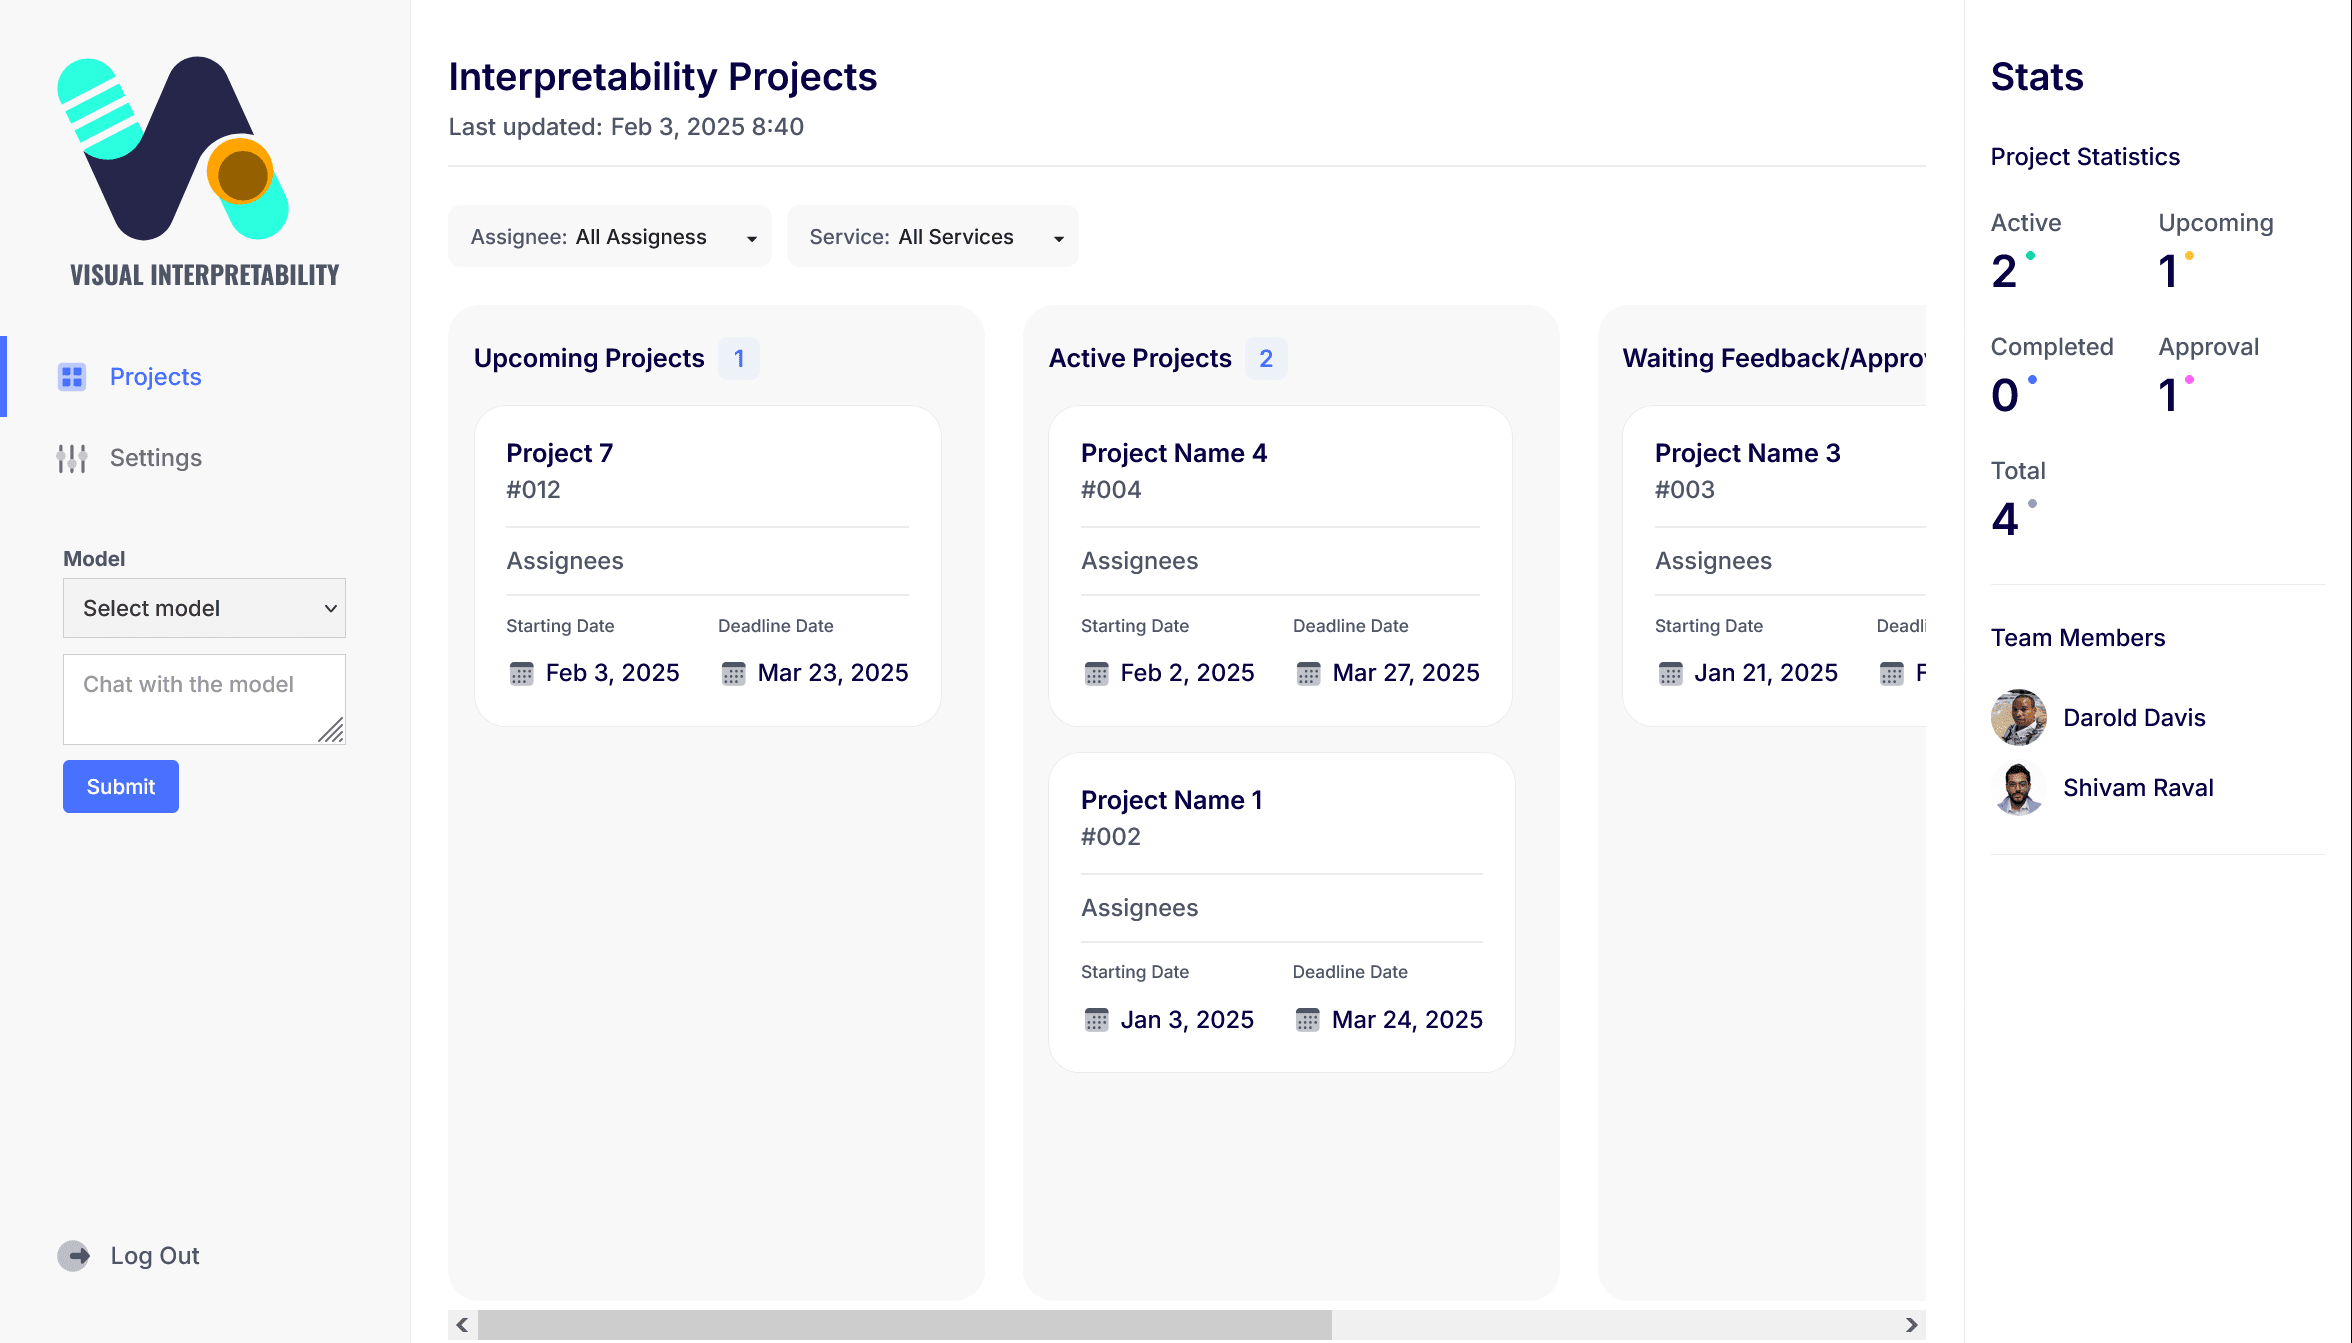
With qualitative data and secondary market analysis, I developed a prototype of a web-based tool using HTML, CSS and JavaScript (D3.js) to visualize activation patterns across network layers. The initial objective was to incorporate the insights I gained throughout the research and rapid build a mockup that could be iterated on over subsequent usability testing sessions. Enable interactive exploration of neuron contributions.
First, the focus was on a designing the projects dashboard for the purpose of managing interpretability visualizations with different techniques and with other collaborators.
For this prototype, explored three different visualizations and the type of inspection methods most suitable. What follows are brief descriptions of the visualization types I focused on for this project, the inspection methods and screenshots of the prototype UI.
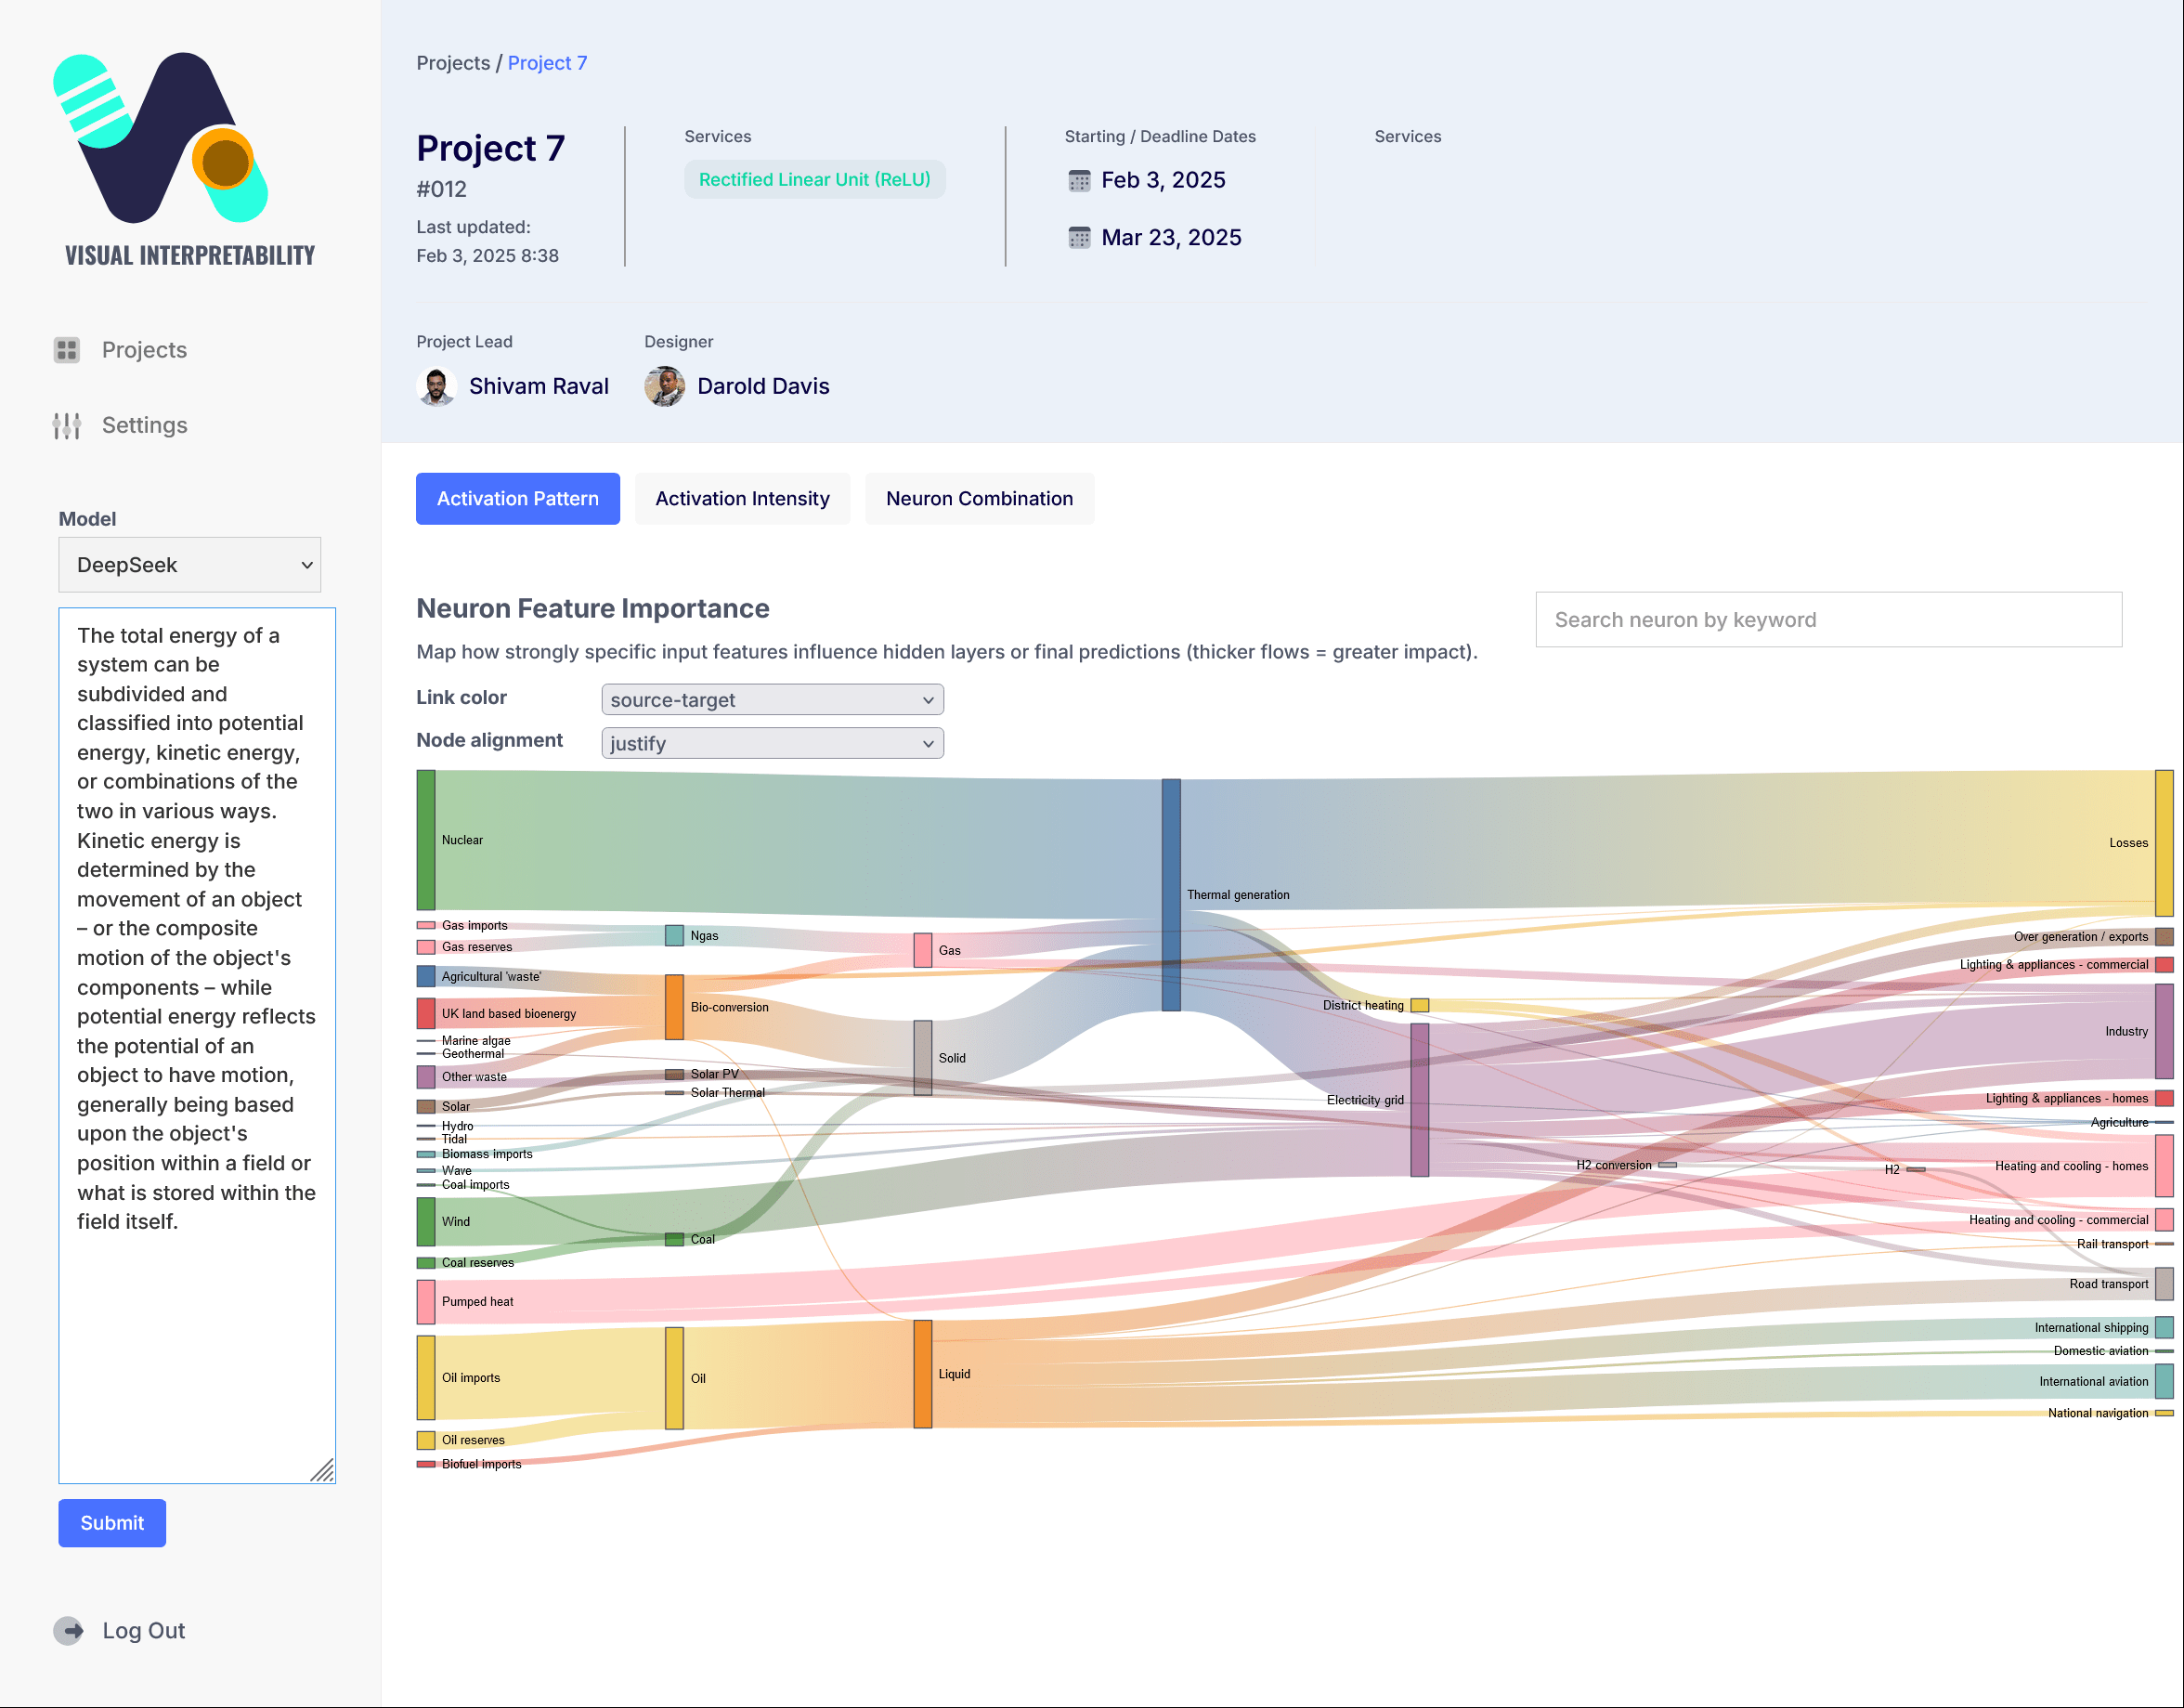
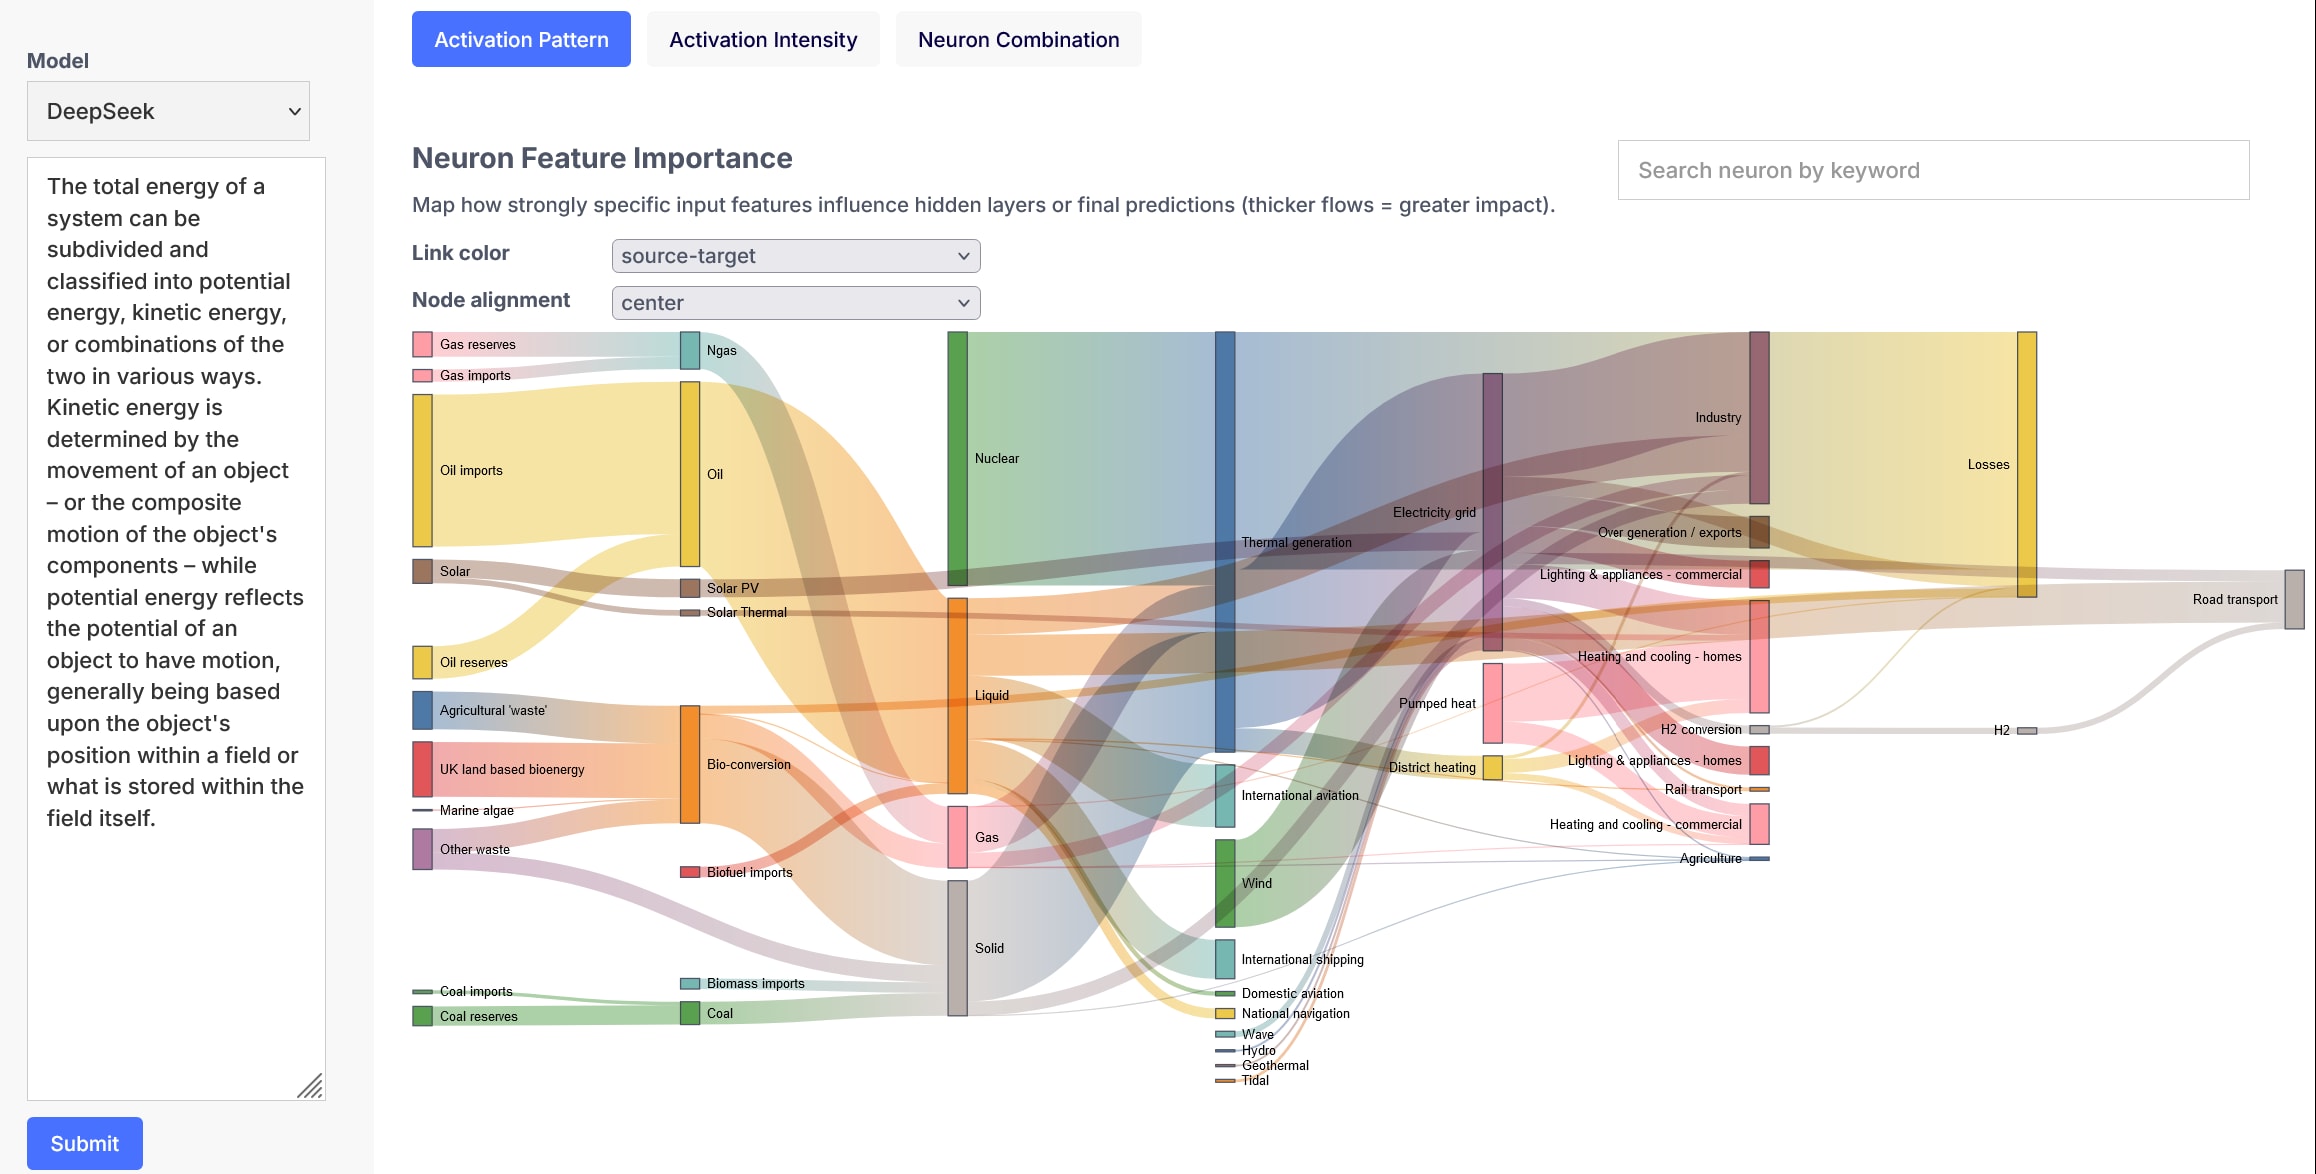
Sankey Diagram
Sankey is a flow visualization tool where the width of arrows represents the quantity or magnitude of flow. For neural networks, it can effectively illustrate dynamic relationships and quantitative distributions. Below are key aspects a Sankey diagram could visualize:
- Relevance Propagation: Trace how output decisions map back to input features (e.g., Layer-wise Relevance Propagation).Activation Patterns: Track activation intensities for specific inputs across layers.
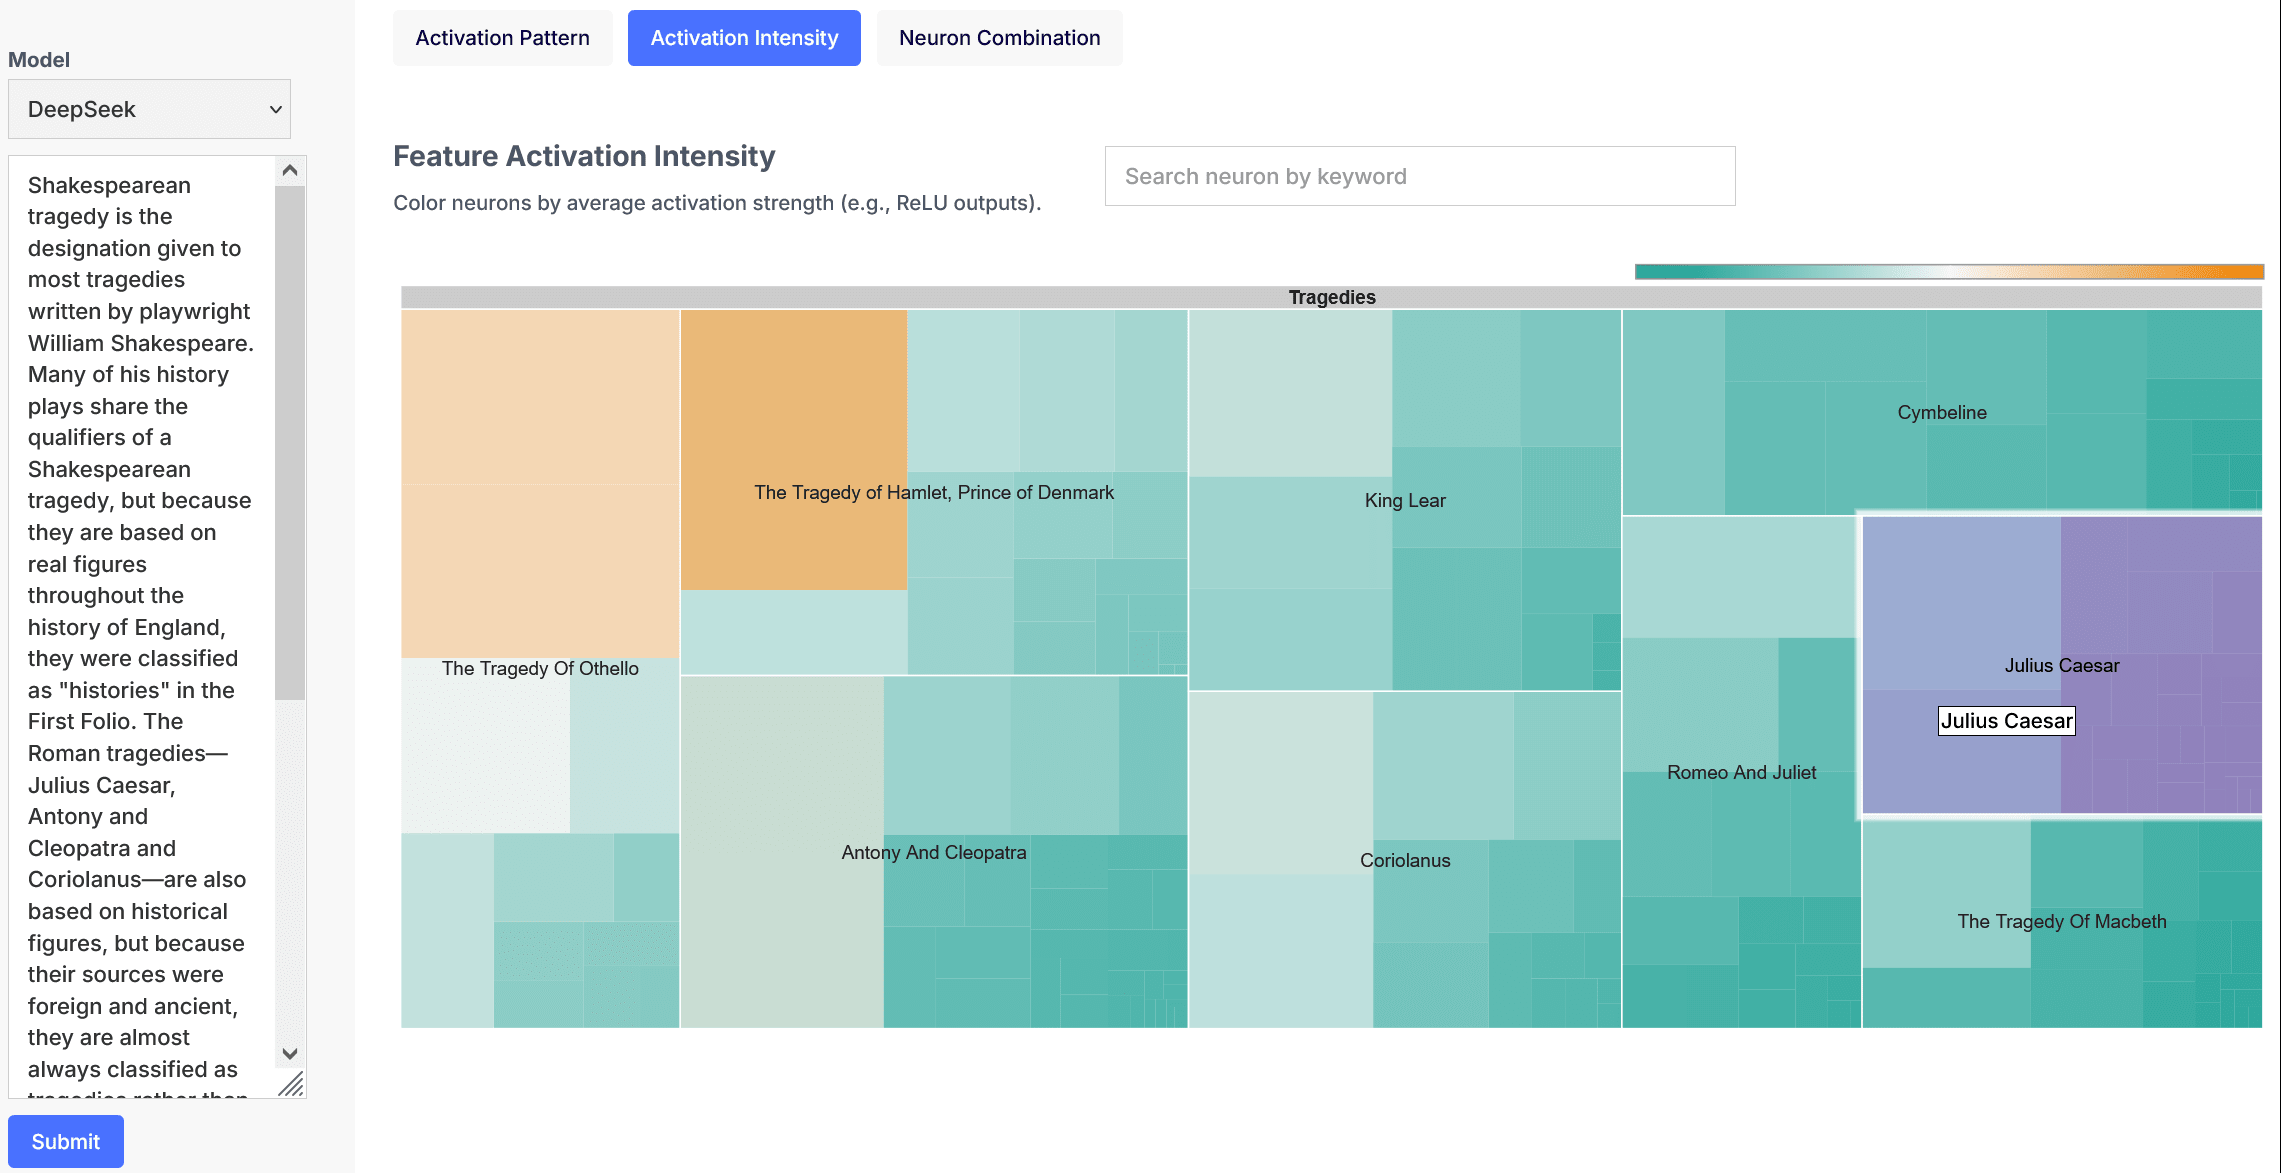
TreeMap
A treemap diagram is effective for visualizing hierarchical and part-to-whole relationships through nested rectangles, where size and color can encode quantitative or categorical variables. For neural networks, treemaps can illustrate the following aspects:
- Feature Activation Intensity: Color neurons by average activation strength (e.g., ReLU outputs).Sparsity: Represent inactive neurons (e.g., dead neurons in poorly initialized networks).
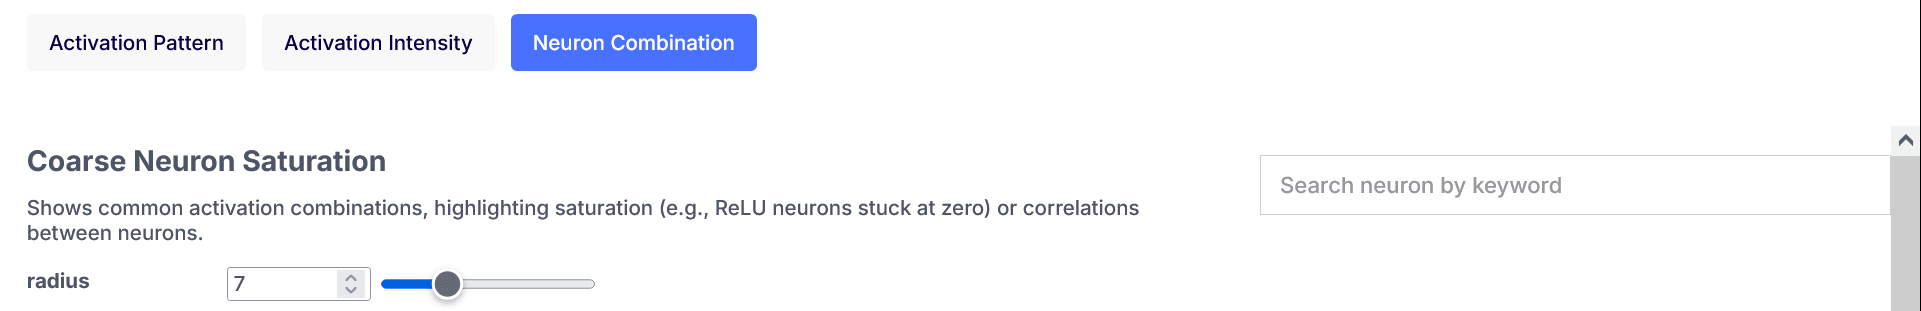
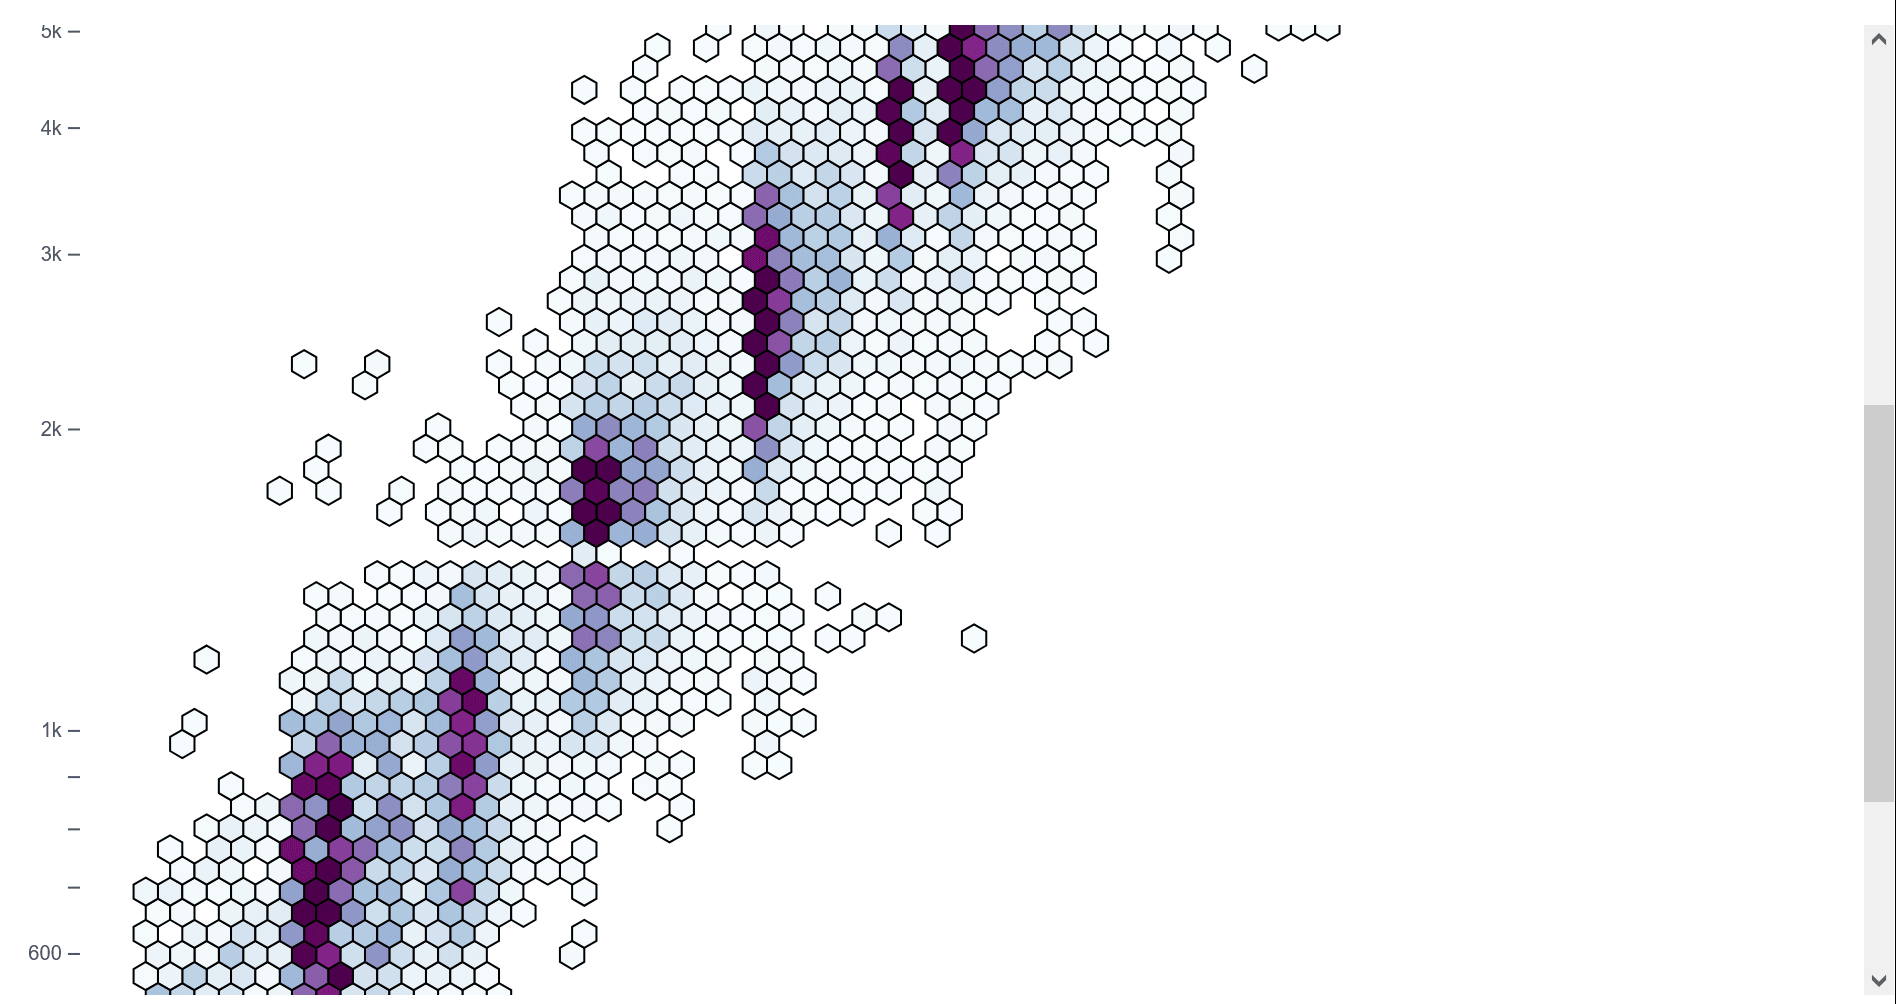
Hexbin Scatter Plot
A hexbin scatter plot, which aggregates data points into hexagonal bins to visualize density, can effectively illustrate several aspects of a neural network model. The key areas where hexbin plots are particularly useful are:
- Visualization: Activations of two neurons (or layers) over a dataset.Insight: Shows common activation combinations, highlighting saturation (e.g., ReLU neurons stuck at zero) or correlations between neurons.
Discussion
Current tools are siloed and lack support for integration with other tools, and lack the ability to visualize finer-grained explanation only for specific units of interest (neuron-level interpretability). This prototype is an initial step in addresses this by integrating activation and attribution visualization into one tool, streamlining the workflow. Validation testing to identify areas for improvement is the next activity as well as ongoing stakeholder and community research to gather additional insights.
This prototype is a work in progress and requires further development to fully realize the benefits to the field. By making model behavior more transparent, our tool helps researchers identify misaligned or biased decision pathways, enabling corrective measures before deployment.
Future work
In order to make this tool accessible to novice researchers as well as experienced researchers in other fields, I intend to expand the survey and interview a broader audience of industry practitioners. Other plans are to:
- Conduct usability testing for the prototype and iterate.Explore adding more interactivity and other types of visualizations.Add support for dynamic computation graphs (e.g., Transformers).Integrate quantitative metrics such as attribution consistency scores.
By addressing these steps, the aim is to create a robust, widely adoptable tool for ML interpretability, advancing the safety of AI systems.
Acknowledgements
I would like to express my deepest gratitude to Shivam for giving me his time, insights and knowledge regarding machine learning interpretability.
References
| [1] | Z. C. Lipton, ‘The Mythos of Model Interpretability’, arXiv [cs.LG]. 2017. |
| [2] | C. Rudin, C. Chen, Z. Chen, H. Huang, L. Semenova, and C. Zhong, ‘Interpretable Machine Learning: Fundamental Principles and 10 Grand Challenges’, arXiv [cs.LG]. 2021. |
Discuss
