
AI is becoming a part of our daily lives, from approving loans to diagnosing diseases. AI model outputs are used to make increasingly important decisions, based on smart algorithms and data. But if we can’t understand these decisions, how can we trust them?
One approach to making AI decisions more understandable is to use models that are inherently interpretable. These are models that are designed in such a way that consumers of the model outputs can infer the model’s behaviour by reading the parameters of the model. Popular inherently interpretable models include Decision Trees and Linear Regression. Our work, published at IJCAI 2024, takes a broad class of such models called Logistic models and proposes an augmentation, called Linearised Additive Models (LAMs)
Our research shows that LAMs not only make decisions made by logistic models more understandable but also maintain high performance. This means better, more transparent AI for everyone.
To understand LAMs and logistic models consider the following scenario. Imagine you’re a real estate agent trying to predict the price of a house based on its size. You have data on many houses1, including their sizes and prices. If you plot this data on a graph, Linear Regression helps you draw a straight line that best fits these points. This line can then be used to predict the price of a new house based on its size.
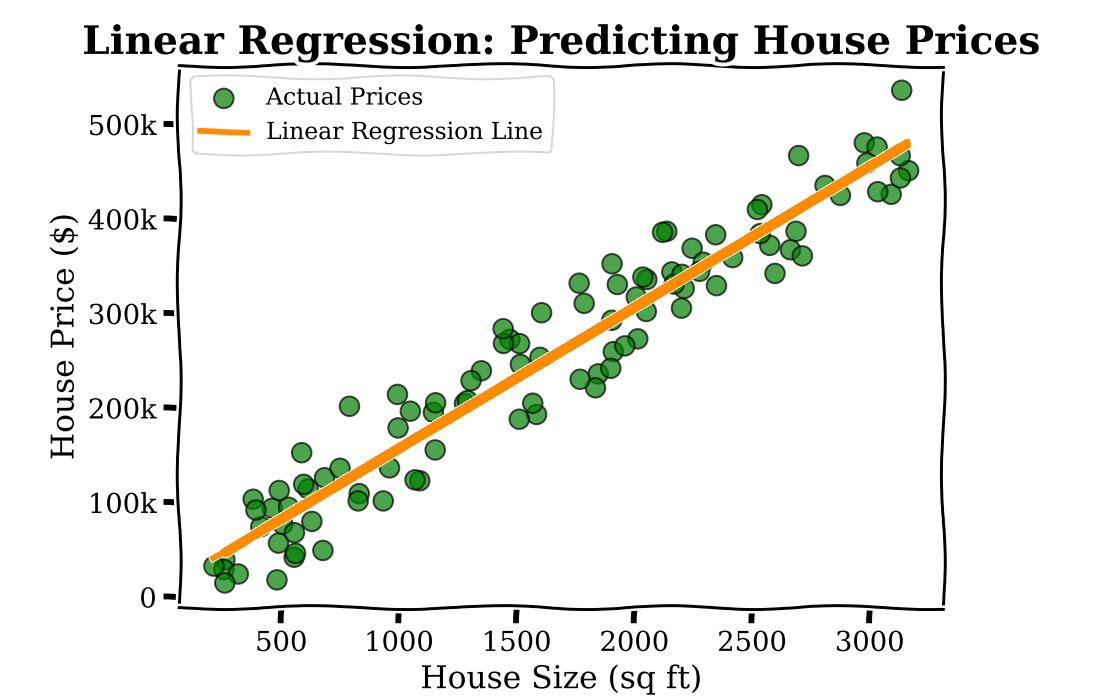
Linear Regression is an inherently interpretable model, in that the parameters of the model (here there is one parameter associated to the square footage,  ) has a straightforward interpretation: every extra sq ft in home size leads to an additional cost of
  .
.
Now imagine you are trying to predict something slightly different using the same data; namely, the binary outcome, or yes–no question, of whether a house price is above  or not. Typically a modeller here would use Logistic Regression. This method helps draw a curve that separates houses that sell above that amount from those that don’t, giving a probability for each house. In the plot below, we show a Logistic Regression to predict sales status, whether the house sells for greater than
  or not.
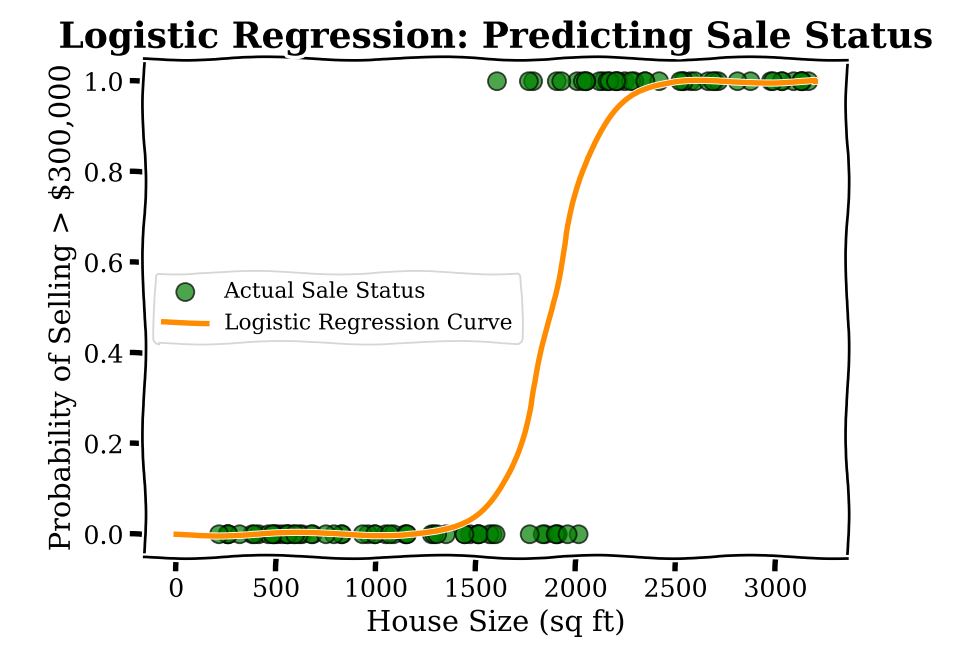
Unfortunately, while the model is transparent, in the sense that there aren’t many parameters (for our example here there are only two), the coefficients of logistic regression do not have a straightforward interpretation. At any given square footage, the additional cost incurred by adding 100 sq ft is different. For example the change in probability from 600 to 800 sq ft is different as compared with the change in probability going from 1600 to 1800 sq ft. This comes from the fact that under a Logistic Regression model, the predicted probability of a sale is a non-linear function of square footage.
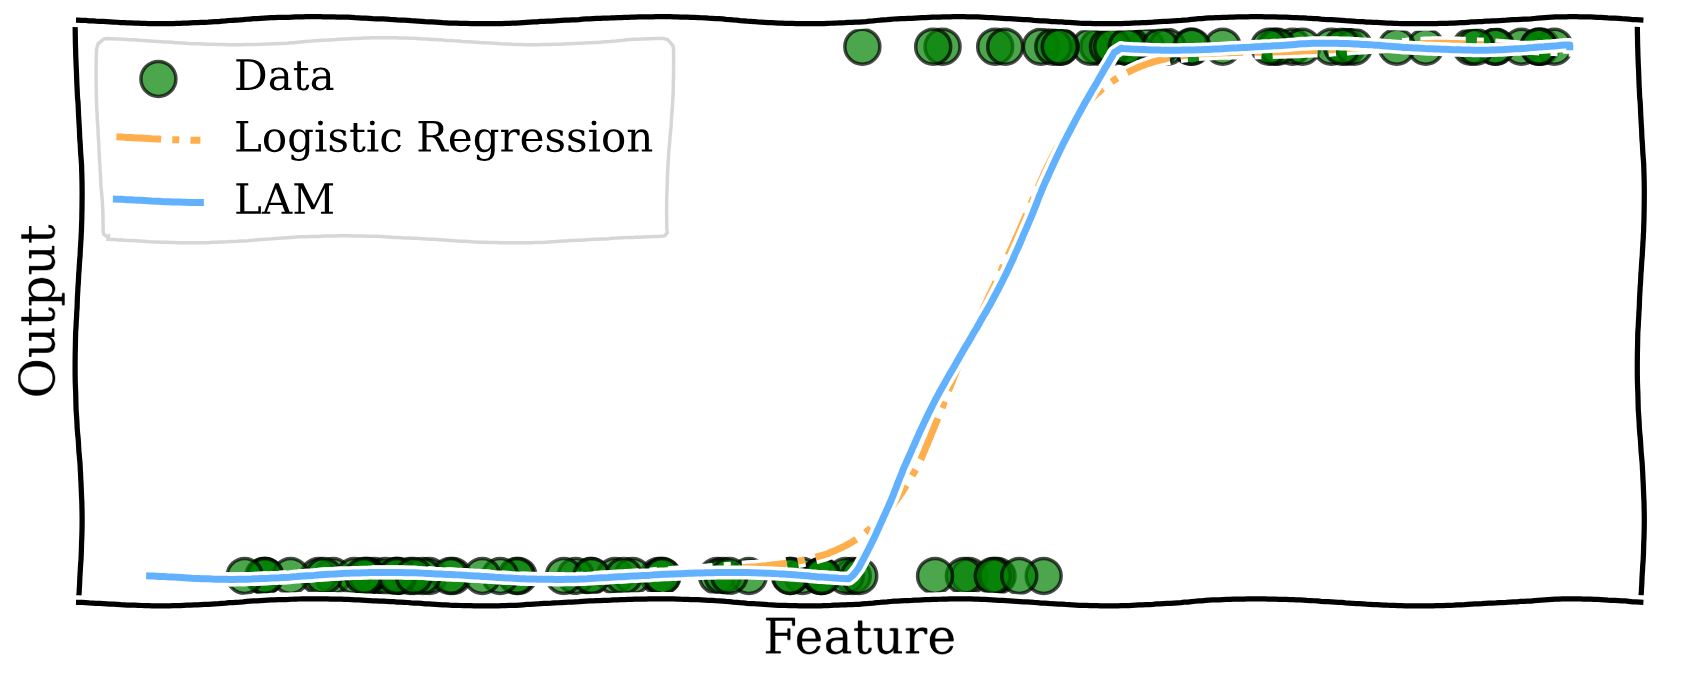
What LAMs do is bring the interpretability of Linear Regression to models that predict the answers to yes–no questions, like Logistic Regression. We modify logistic models to use linear functions to predict probability. The method is very simple and illustrated by the curve below.
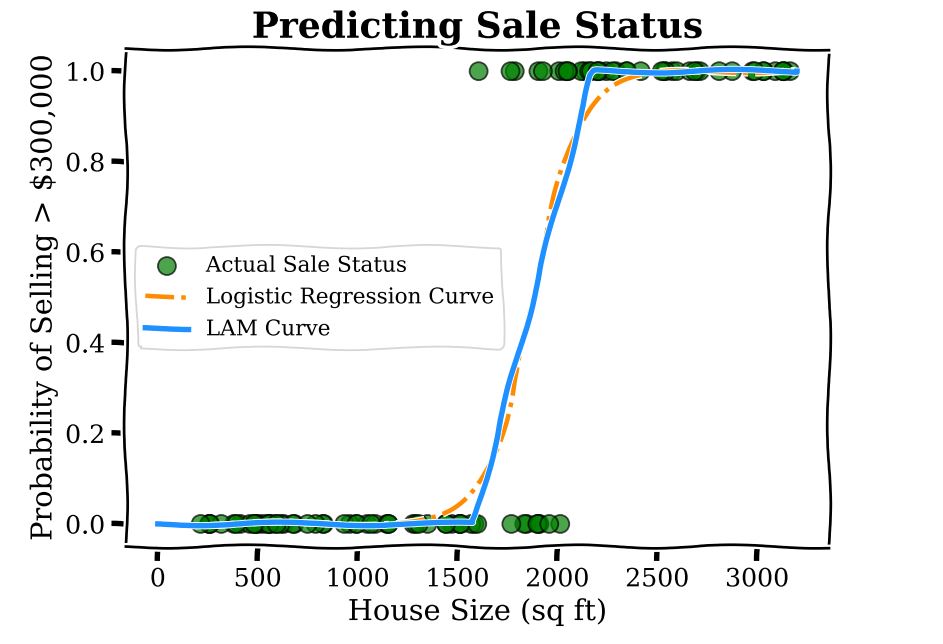
What we have is three regions: below 1500 sq ft, where the predicted probability for the price to be greater than is zero; above 2000 sq ft where the probability is one; and the middle region of 1500-2000 sq ft which linearly interpolates between the two regions, that is, the model output is found by drawing a straight line between the end of the zero probability region and the beginning of the probability one region. Within this region the coefficient corresponding to square footage is  0.002, which is interpreted as every additional sq ft increasing the predicted probability of the sale by 0.002. As a concrete example, increasing the home size from 1600 to 1700 sq ft increases the LAM predicted probability of a sale by 0.2. This interpretation of the coefficient is the same were we to increase the home size from 1700 to 1800 sq ft, because of the linear function used.
Contrast this with the logistic model where we weren’t able to provide such an easy description of the model. Notice that the LAM curve is very close to the Logistic Regression curve, which is by design. LAMs leverage the efficient training routines developed over decades for Logistic Regression models and act as a post-processing step to enhance interpretability.
To understand which type of AI model is easier for people to use, we conducted a survey comparing traditional logistic models with our new Linearised Additive Models (LAMs). Participants were given several scenarios where they had to predict how the models’ outputs would change based on different inputs.
In the first task, they guessed whether the output would increase or decrease. In the second task, they estimated the size of the change. Finally, they told us which model they found easier to use. We can observe the results in the charts below.
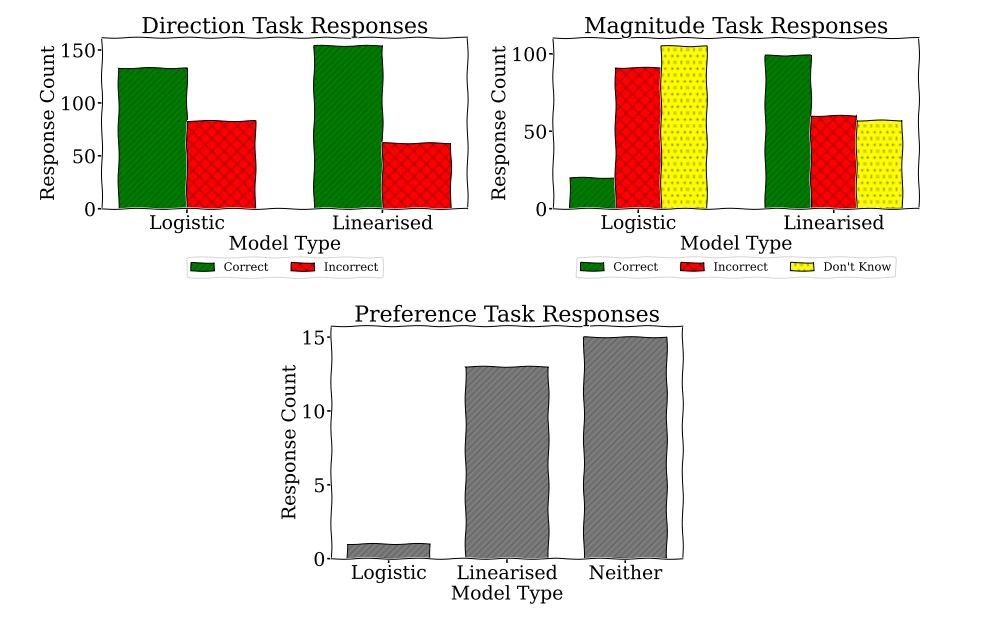
We found that people achieved better results at predicting the direction of change with the LAMs. They were much better at estimating the size of the change with the LAMs. Most participants said neither model was particularly easy to use, but more people preferred the LAMs.
This suggests that LAMs are generally easier to understand and use, which could make AI decisions more transparent and trustworthy. However, the fact that many participants still found both models challenging indicates that we need better ways to help people understand how AI models work under-the-hood, especially when used for important decisions.
If you wish to find out more about this work, you can consult the full paper Are Logistic Models Really Interpretable?, Danial Dervovic, Freddy Lécué, Nicolás Marchesotti, Daniele Magazzeni.
1This data is synthetic, generated for this article.
Disclaimer: This blog post was prepared for informational purposes by the Artificial Intelligence Research group of JPMorgan Chase & Co. and its affiliates (“JP Morgan”) and is not a product of the Research Department of JP Morgan. JP Morgan makes no representation and warranty whatsoever and disclaims all liability, for the completeness, accuracy or reliability of the information contained herein. This document is not intended as investment research or investment advice, or a recommendation, offer or solicitation for the purchase or sale of any security, financial instrument, financial product or service, or to be used in any way for evaluating the merits of participating in any transaction, and shall not constitute a solicitation under any jurisdiction or to any person, if such solicitation under such jurisdiction or to such person would be unlawful.
© 2024 JPMorgan Chase & Co. All rights reserved
