
Published on November 4, 2024 9:11 PM GMT
Thank you to Justis Millis for providing feedback and proofreading on this post. This post is also available on my Substack.
TL/DR: Contrary to the theory that neurological sex differences and autism both involve the same tradeoff of systemic versus empathic thinking, I found complex differences. It turned out that men were more interested in technology and more disagreeable, whereas autistic people had a narrower focus on details, were more introverted, more socially challenged, and had stronger sensory sensitivity.
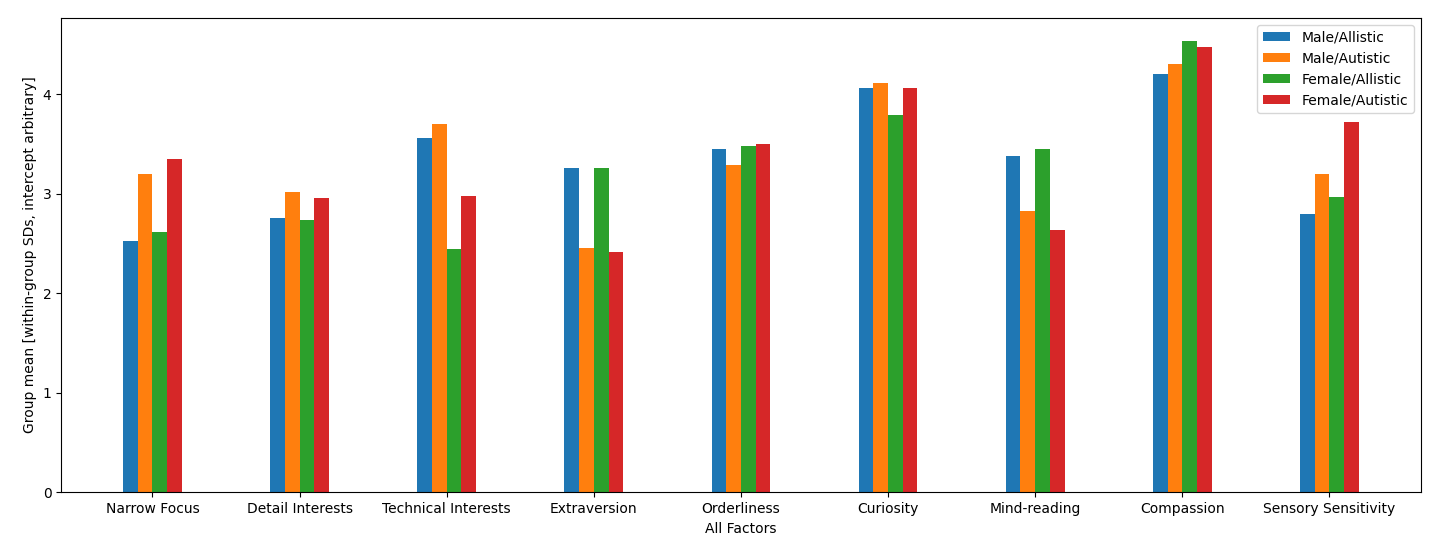
I asked people on Prolific a bunch of questions that are supposed to be related to autism, systemizing and empathy. As a preview before I get into the details, the overall results can be seen here:
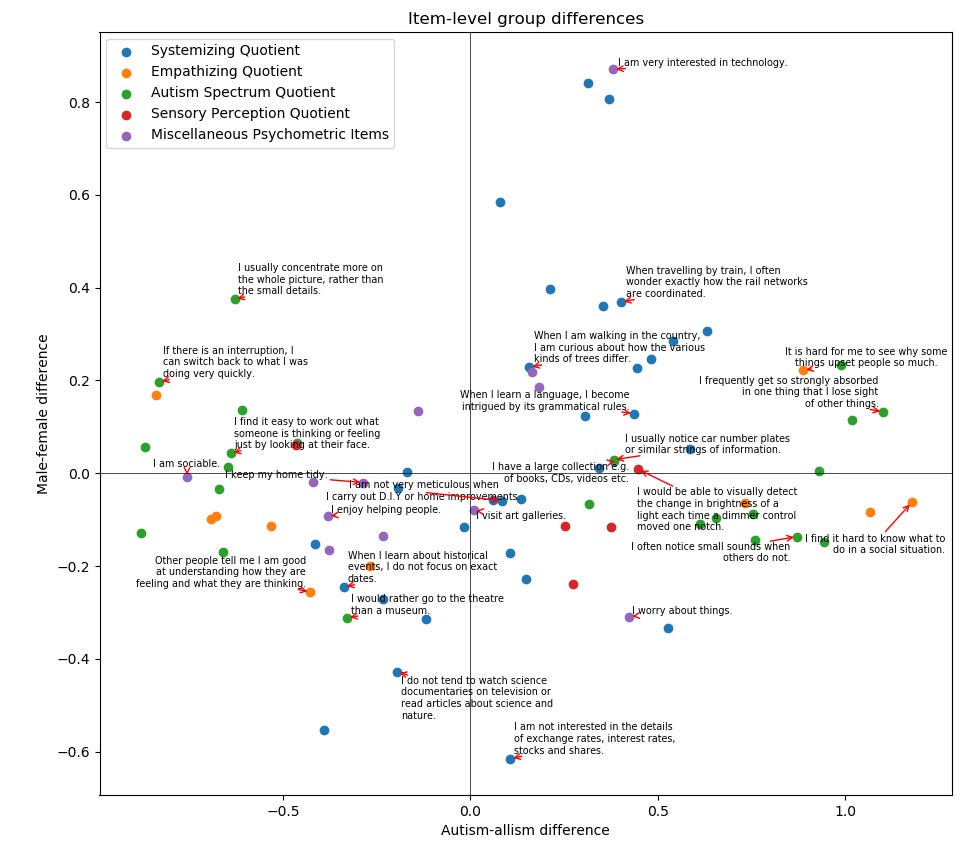
If there was only a single underlying tradeoff that all of these scales were measuring, then we would expect all of the group differences to be highly correlated, with the items just varying based on how well they “tap into” this underlying tradeoff. As that is not what we see, I think there’s something more complicated going on.
Background
The Empathizing/Systemizing theory of autism asserts that there’s a neurological tradeoff between Empathizing (understanding people’s emotions) and Systemizing (understanding how deterministic, rule-based systems work), and that men and autistic people are more prone to Systemizing, whereas women and allistic people are more prone to Empathizing. Furthermore, it asserts that a deficit in Empathizing or a switch towards Systemizing over Empathizing is not merely a feature of autism, but rather core to what autism is.
The main proponent of this theory is Simon Baron-Cohen, who often justifies it in terms of several psychometric scales he’s made to measure traits like Systemizing, Empathizing or autism. A recent example is Testing the Empathizing-Systemizing theory of sex differences and the Extreme Male Brain theory of autism in half a million people (2018), a study where he claims to find support for his theory.
I used to consider the theory plausible, but I ran into several problems. Some formulations of the theory go really heavily into the idea that the Empathizing-Systemizing axis is the core of feminine/masculine psychology, but that seems somewhat sketchy. Simon Baron-Cohen’s scales have been criticized for sex bias, but while he came up with a scale that supposedly balanced out the bias, he didn’t use the standard psychometric methods for testing for sex bias, and when I took a superficial look with those methods, it still seemed biased. Furthermore, genetic studies of empathy and systemizing seem to have found it to be close to independent of autism. As such, I became suspicious the theory might be false.
Data
For the main analysis, I collected a bunch of items supposed to be relevant for measuring autism. The full item list can be seen in the appendix. To get data, I used Prolific to recruit 100 non-autistic men, 100 non-autistic women, 50 autistic men diagnosed in childhood, 50 in adulthood, 50 autistic women diagnosed in childhood and 50 in adulthood.
I asked the respondents to rate each item on a scale from “Disagree strongly”, “Disagree”, “Neither", “Agree” to “Agree strongly”. To quantify the data, I mapped these response options to -2, -1, 0, 1, and 2. Also, sometimes to make the computation more convenient, I divided by the standard deviation.
I also had a bunch of ideas for follow-up analyses, but they didn’t really lead anywhere, so I’m not going to publish them here right now. If you want access to the data, contact me and I will provide it.
Principal component analysis
“Empathizing” and “Systemizing” are generally conceived of as quite abstract general traits, but (especially for Systemizing) many of the items are quite concrete and narrow, e.g. “If I were buying a computer, I would want to know exact details about its hard drive capacity and processor speed”.
This is fine and perfectly intentional. If we expect a general trait to influence many distinct behaviors within a person, we can infer the level of the trait by looking for this overall pattern of behaviors, rather than any one specific behavior. In fact, unless we know the root cause of variation in a general trait, this seems to be the only way to measure a general trait.
One way to quantify patterns of variation is to use principal component analysis, which lists independent axes in the data in descending order of variance. Because the item responses occur in a bounded range from -2 to 2, no individual item has much variance. Instead, the primary variance occurs because of the correlation between the items (so some people are outliers on many items at once), and therefore principal component analysis narrows in one the dimensions that are relevant to general traits.
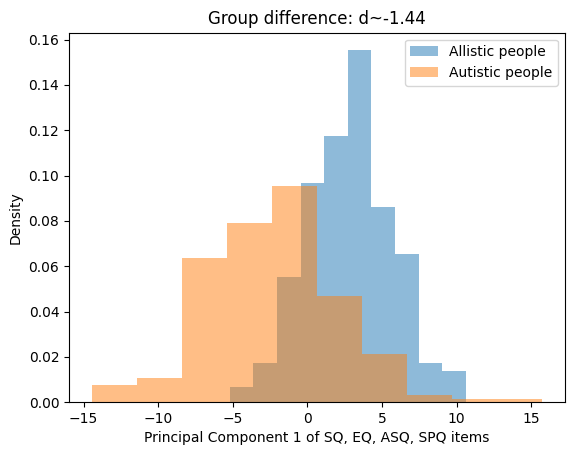
As a sanity check, if I extract the first principal component of all the items, I get a score with a reasonably large separation between the autistic and allistic respondents, though with significant overlap and many outliers:
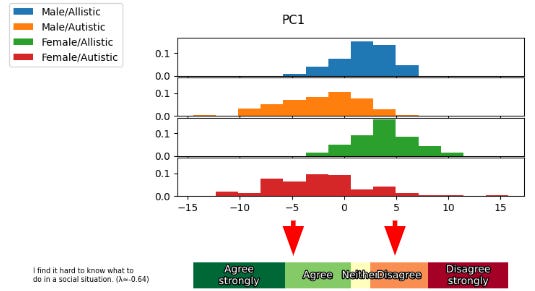
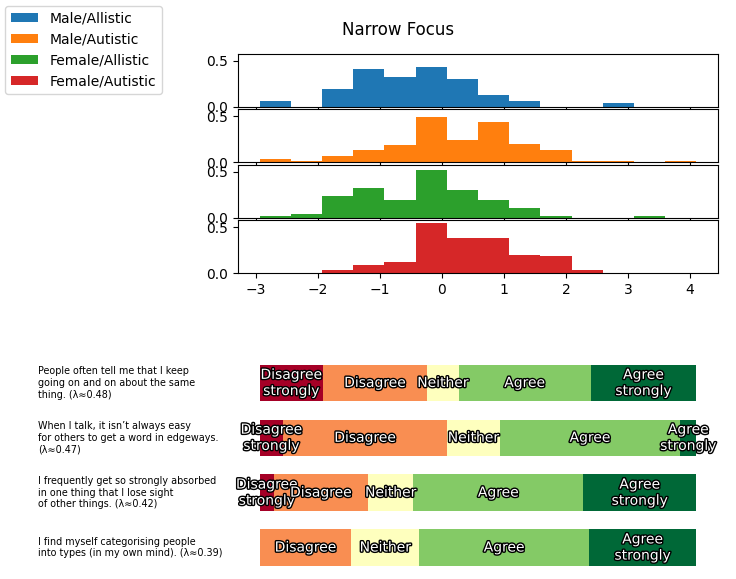
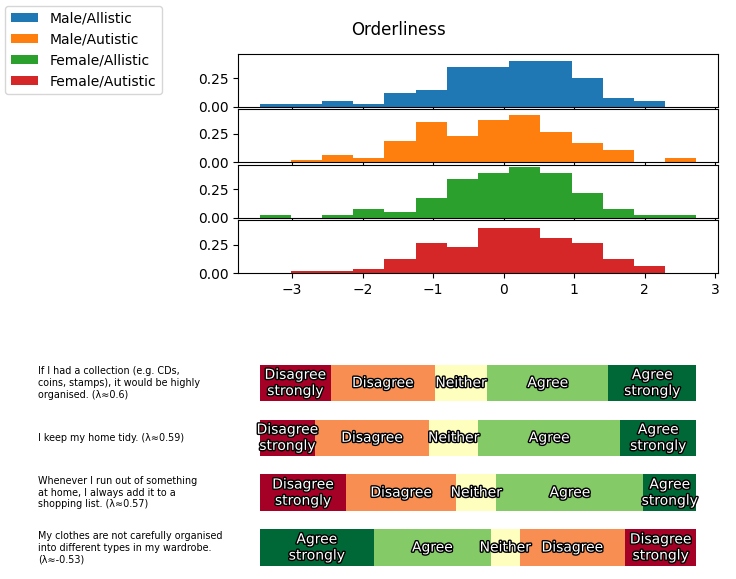
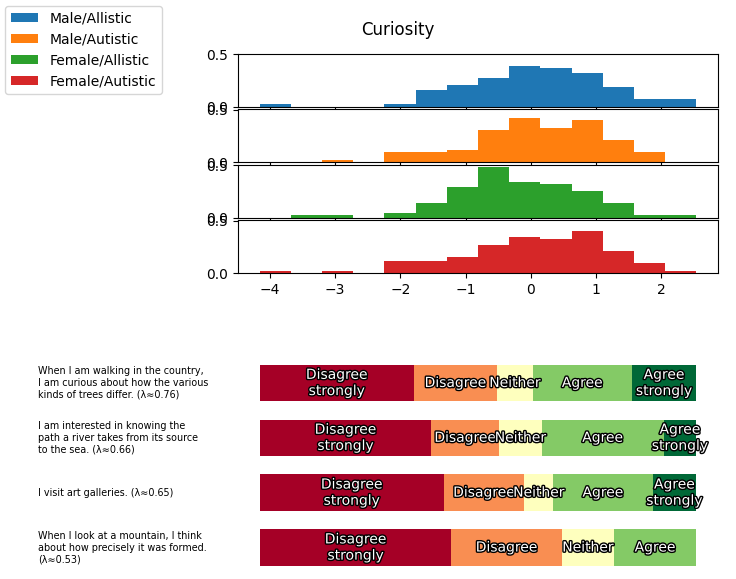
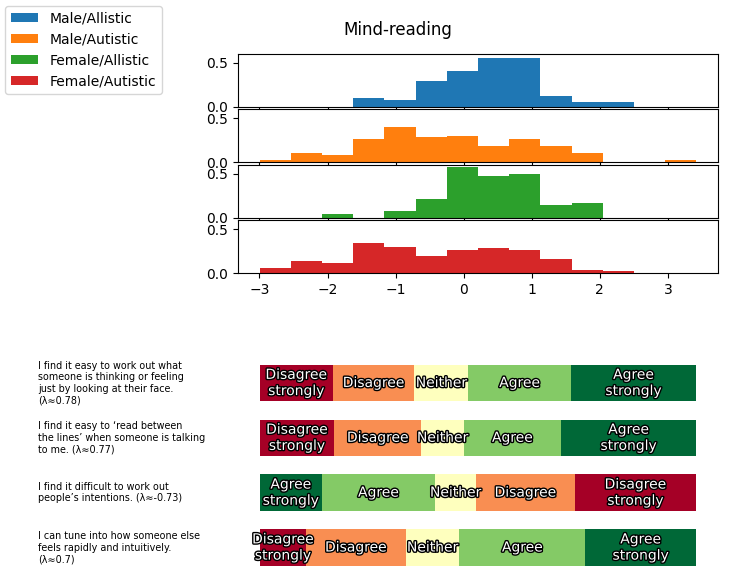
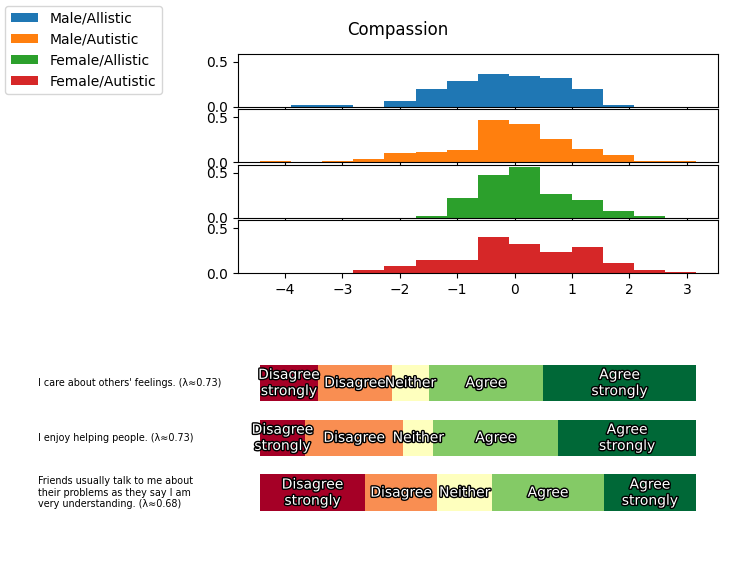
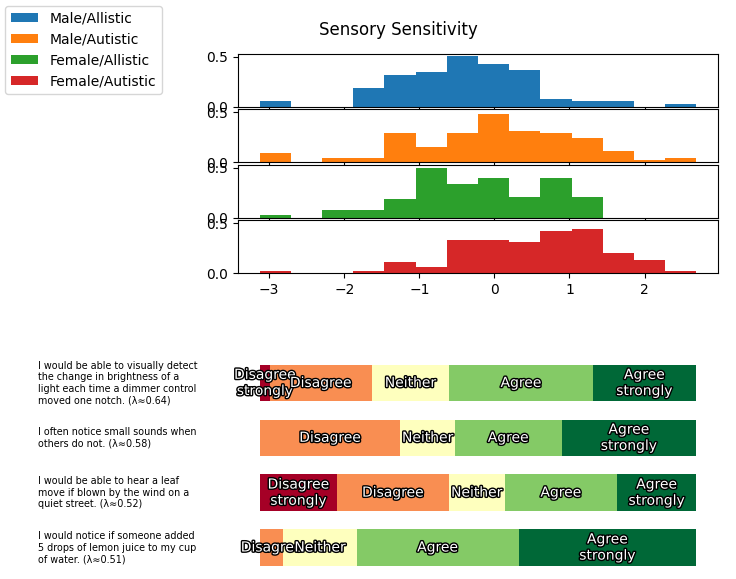
An overall score like this can be hard to relate to, in my opinion. One thing that helps add semantics to the score is seeing how the score relates to the survey responses, so I’ve invented this new kind of diagram to map that out:
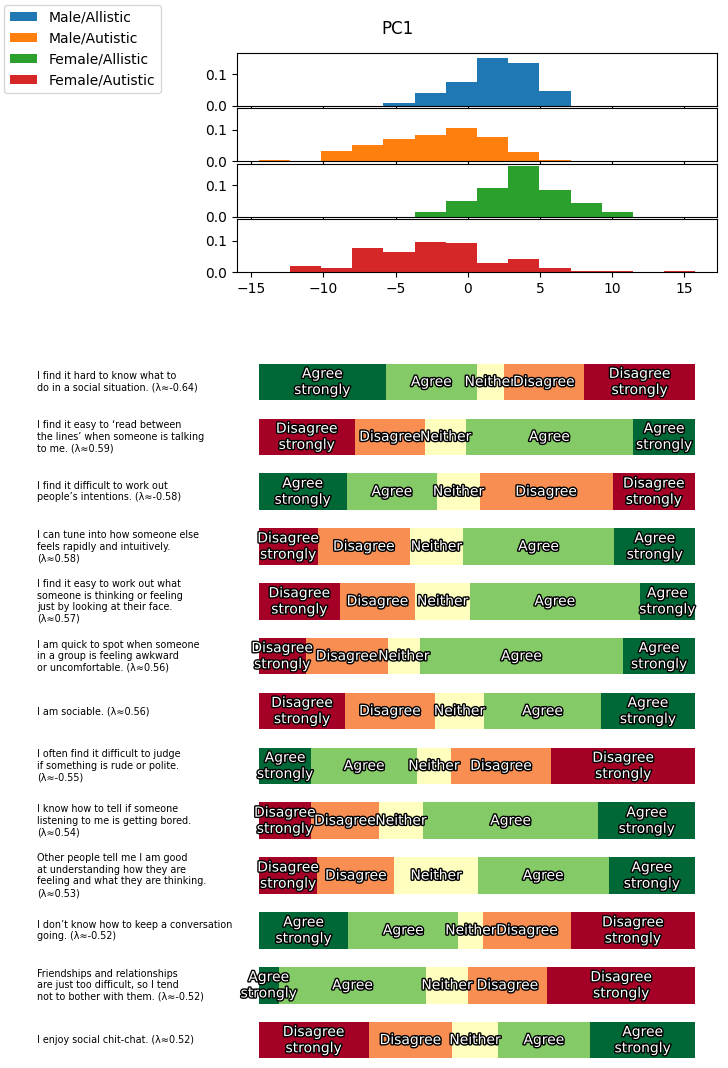
Basically, at the top of the diagram, you see the distribution of responses for each group. Below this distribution, you see the median item response for people at a given level of the distribution. So for instance, for the item “I find it hard to know what to do in a social situation”, the label below the 5 score is “Disagree”, while the level below the -5 score is “Agree”, corresponding to the median responses from people at scores of 5 and -5 respectively.
Measurement invariance
This whole discussion started because I was concerned about test bias in the autism metrics. To better illustrate this, I have the following plot:
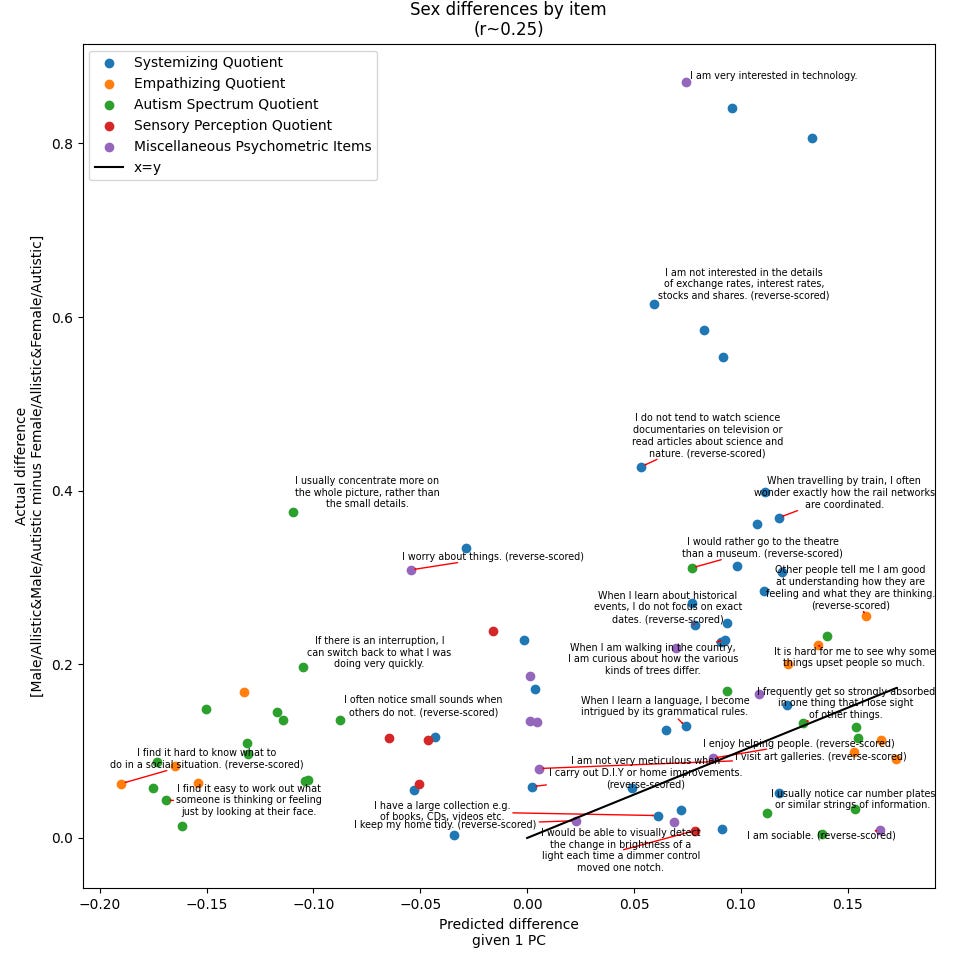
Each dot in the plot shows an item, and on the y-axis, we see the sex difference for said item. Notably, the sex difference for the item “I am very interested in technology” is very large. That fact alone of course doesn’t intrinsically prove that the item has a sex bias, since if the theory is correct, the item would have a sex difference because men are more prone to Systemizing over Empathizing. However, that is where the x-axis comes in.
If this item is highly reflective of Systemizing vs Empathizing tendencies, then we should expect the item to be highly correlated with the overall score we computed using principal component analysis, and we should expect the score to exhibit a large sex difference too. By multiplying the sex difference in the overall score with the correlation between the overall score and the item, we can get a “predicted sex difference” (according to a single-factor model).
Because it’s relatively easy to predict the sign, to make the test more sensitive I’ve reverse-scored the items with a negative sex difference to emphasize whether it predicts the magnitude of the sex difference. It turns out, this correlation is low, only 0.25.
For contrast, consider what happens if we look at the gap between autistic and non-autistic people:
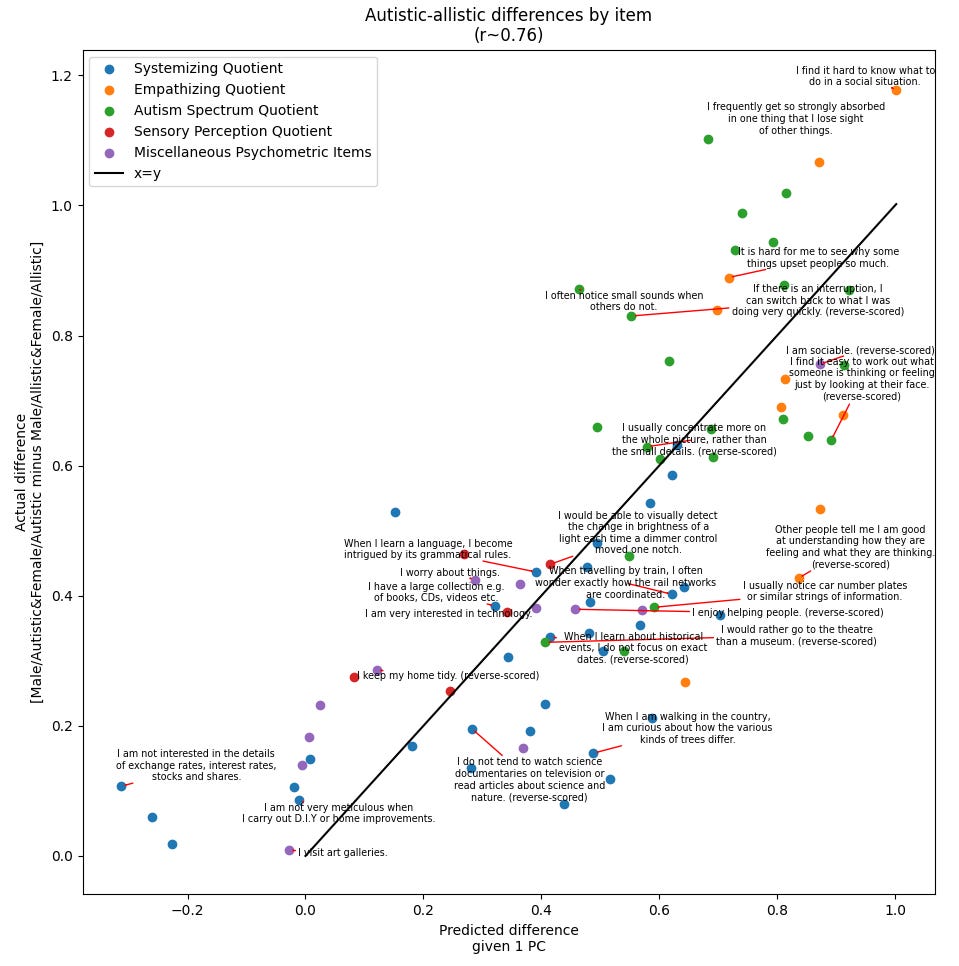
The total score has a large separation between autistic people and allistic people, and an item like “I find it hard to know what to do in a social situation” has a high correlation with the total score even within the groups (so an autistic person who disagrees with this item is also more likely to score low in the overall autism score), which implies a prediction that the item itself ought to have a large separation between autistic people and allistic people too - and indeed it does! This is the case for most of the items, reflected in the fact that the correlation between the predicted group difference and the actual group difference is much higher than for sex (0.76).
It becomes sketchy to even start interpreting or talking about the sex differences in these scores if those sex differences do not reflect sex differences in the items that we expect to be related to the scores. To solve this, we can bring in additional dimensions, rather than trying to reduce everything to a single Autism-Allism or Systemizing-Empathizing dimension. To pick the number of dimensions to use, I look at the correlation between the predicted and the actual sex difference as a function of the number of dimensions:
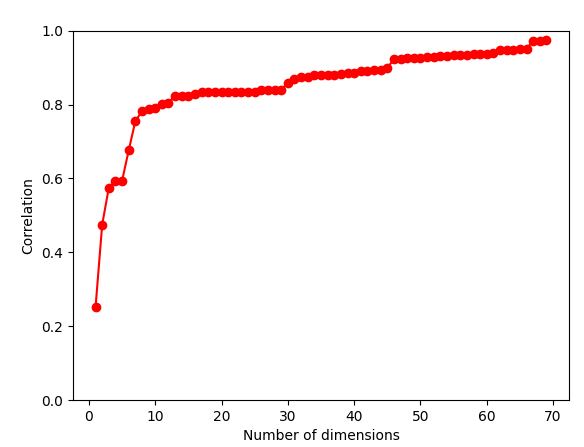
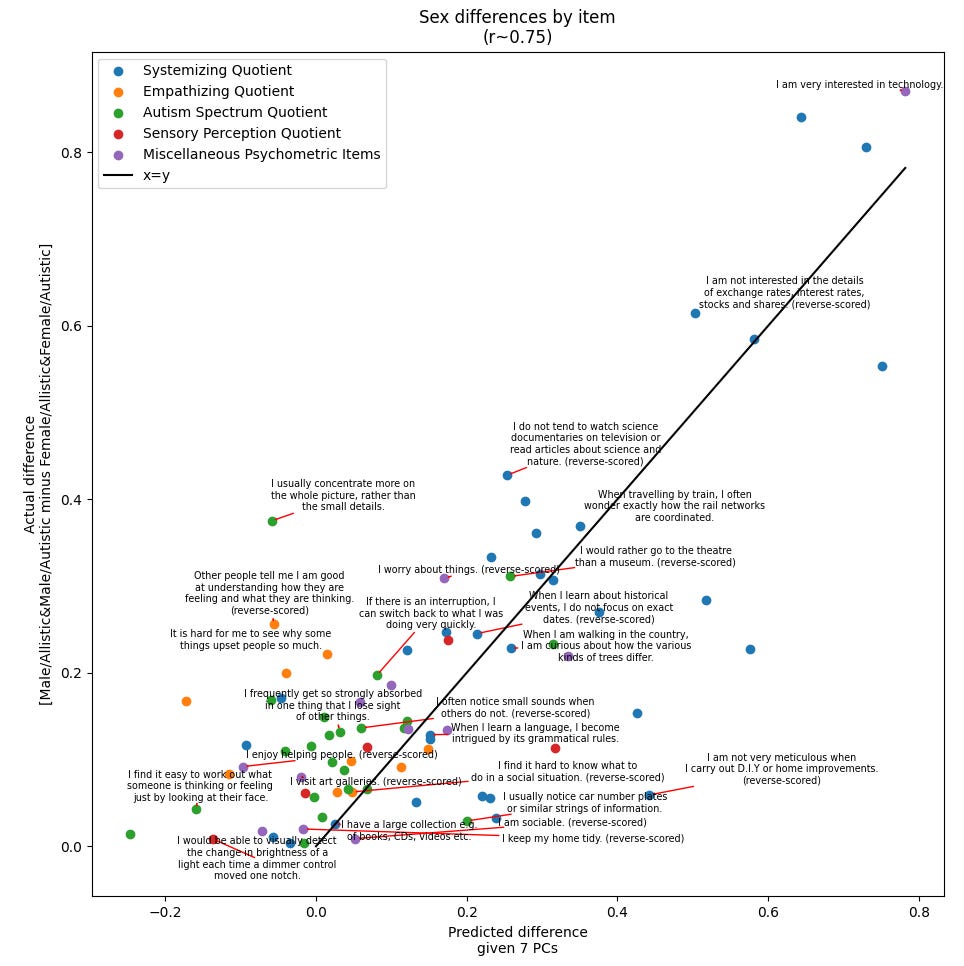
This seems to stabilize around 7 dimensions, so therefore I used principal component analysis to extract 7 principal components. To verify, here’s the predicted vs actual sex differences when using more dimensions (note, the diagram does not show anything about these 7 dimensions, only the predicted properties of the items):
Improving interpretability
It’s a bit hard to intuit what the diagram above is about, because I haven’t explained the meaning of the 7 scored dimensions. Using principal components puts us in a bit of a pickle, because initially we were interpreting the meaning of the score by looking at the relationship between the score and the items, but this relationship becomes very complex as we include more principal components.
To help make it more interpretable, we can apply a linear transformation to the scores to make their relationship with the items sparse. I choose to use the algorithm varimax to find a transformation that keeps each of the scores uncorrelated with the other scores while making the scores’ correlations to the items as sparse as feasible.
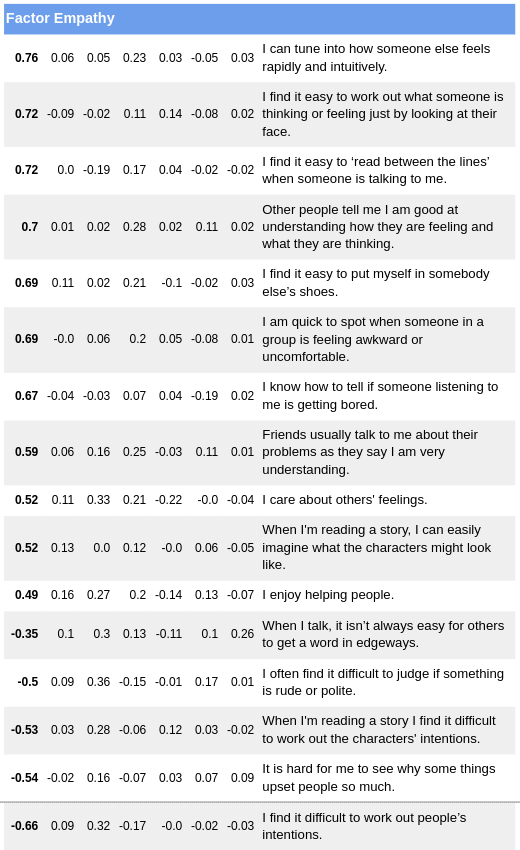
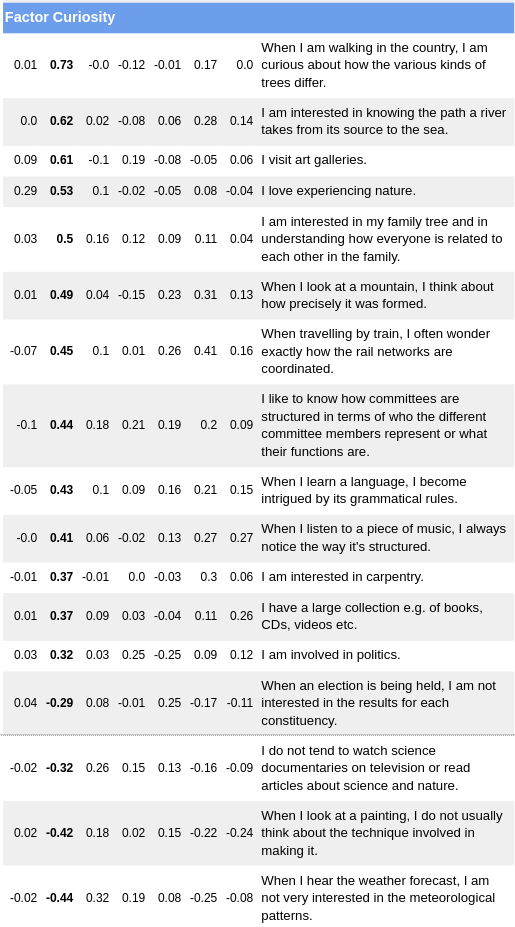
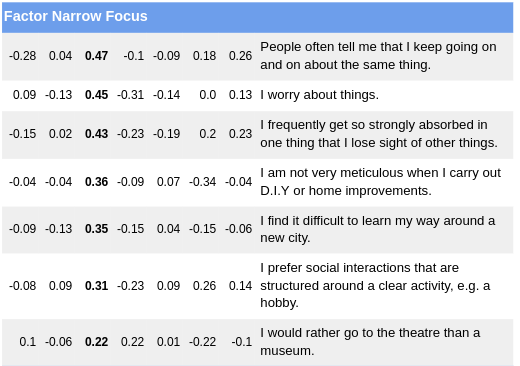
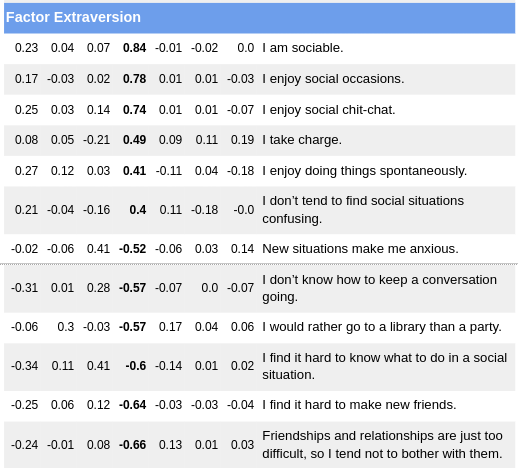
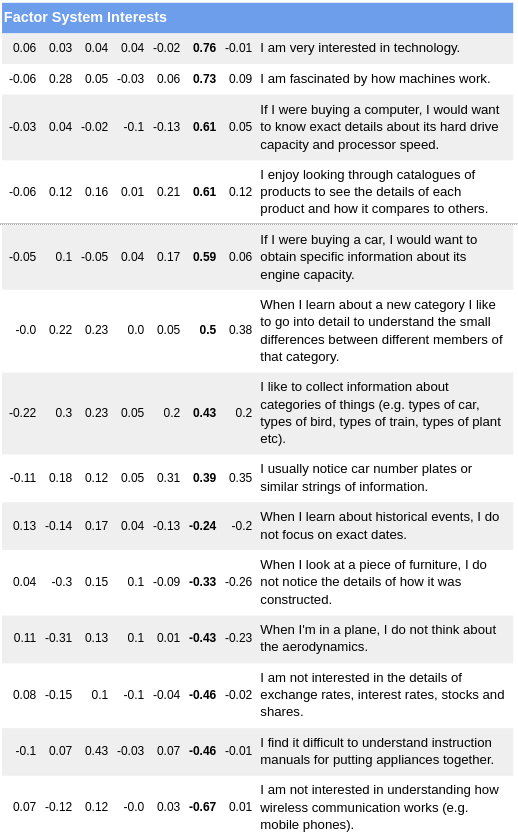
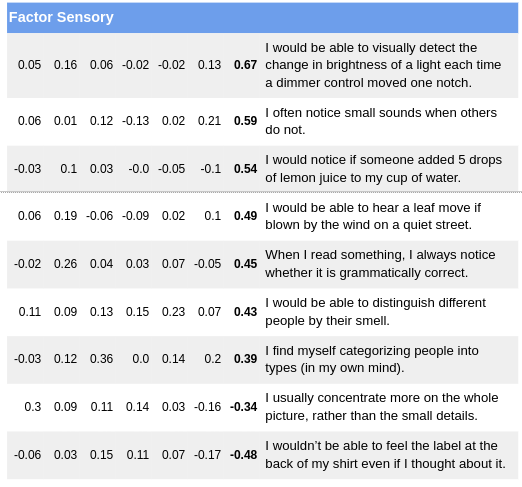
I then gave names to the factors that vaguely described what the items correlated with the factors had in common. The tables with the items and their correlations to the scores can be seen below:
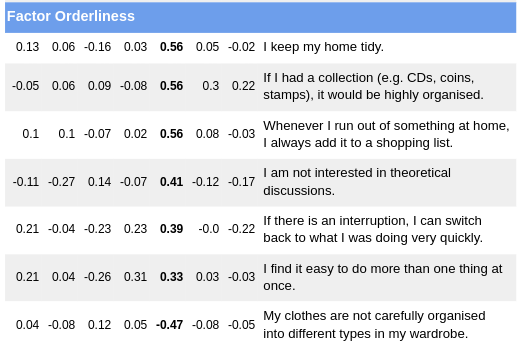
Given these factors, we can show the average level of each of these traits by group. For the plot below, I’ve divided the trait levels by their standard deviation to make the comparison less dependent on the particulars of the scoring:
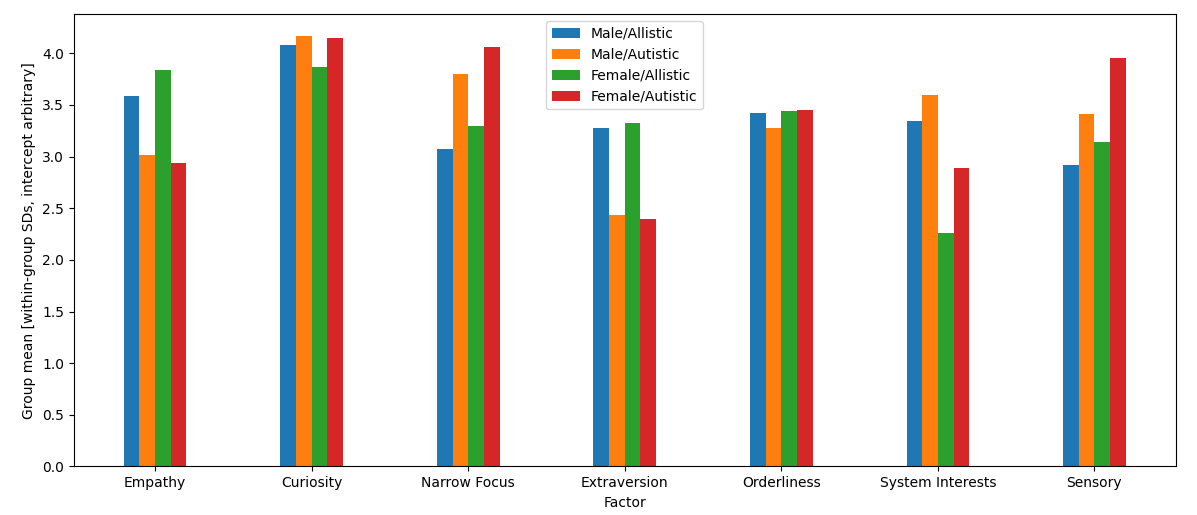
Here, the sex differences are in many ways clearly different from the autism difference. The sex difference is concentrated mainly on System Interests, whereas the autism difference is on most of the other variables, except for Curiosity and Orderliness.
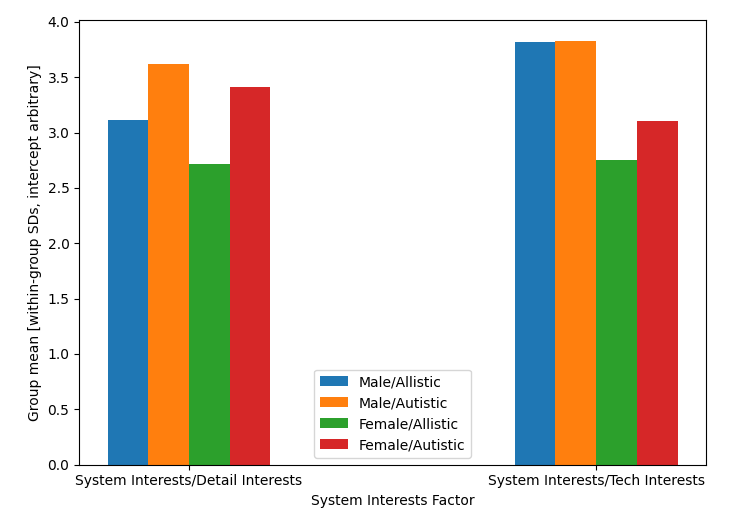
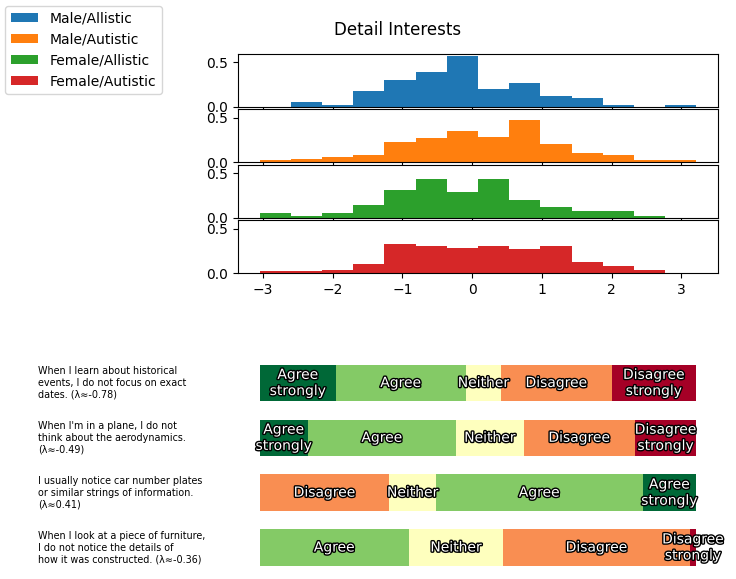
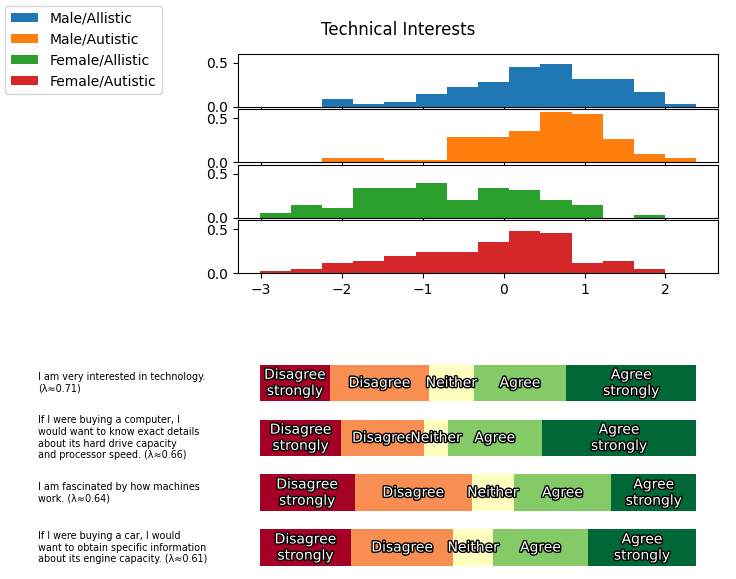
If I take the items that are specific to each factor and apply a similar methodology to the above more narrowly to them, I can also break things down further. For example, System Interests had items like “If I were buying a computer, I would want to know exact details about its hard drive capacity and processor speed.”, which I would consider to be about more technologically-oriented interests, and items like “When I learn about historical events, I do not focus on exact dates.”, which I’d consider to be about more detail-oriented interests. Detail Interests were more autistic, whereas Tech Interests were more male:
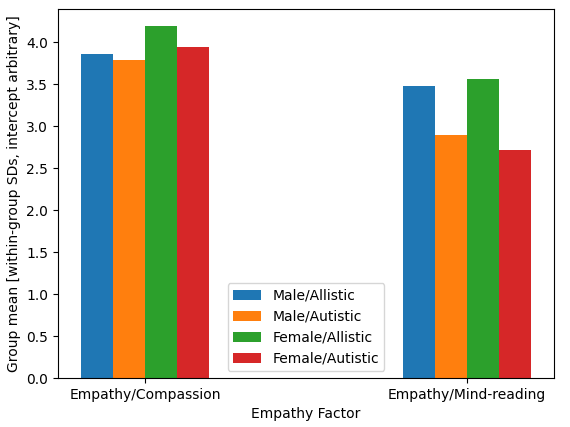
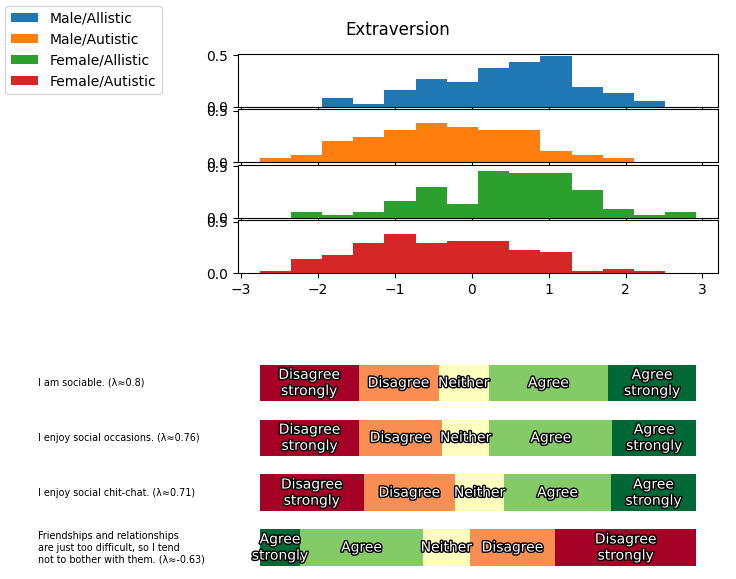
Similarly, the Empathy items included agreeable items like “I care about others' feelings.” as well as items related to understanding others like “I find it easy to ‘read between the lines’ when someone is talking to me.”. It turns out that the sex difference on such items was more concentrated on those involving caring about others, whereas the autism difference was more concentrated on those involving understanding others:
To unify the two frames, I performed varimax again after breaking the item-sets down, yielding something with all the factors, but System Interests and Empathy broken down into two:
Overall, it seems to me that the EQ-SQ theory mixes sex differences and autism-allism differences together in a way that doesn’t really correspond to reality. It’s more accurate to say that men and women have a different pattern of psychological differences than autistic and allistic people do.
Some people also like to look at the dimension optimized for separating the groups, sometimes known as Gender Diagnosticity or Mahalanobis D. I have some philosophical quibbles that make me not-super-enthusiastic about these quantities[1], but I thought I might as well compute them here:
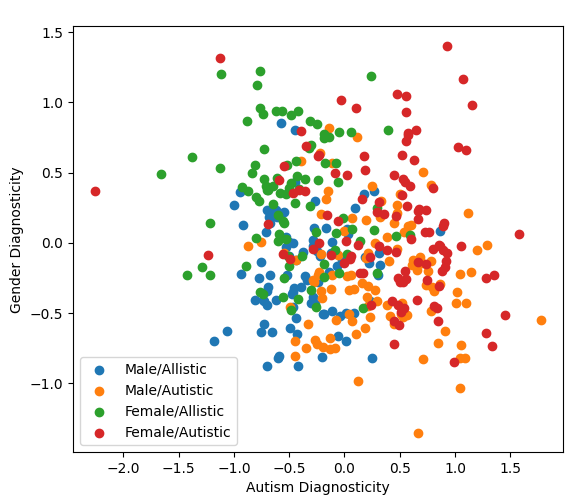
One thing that you might have noticed, either on this diagram or the previous ones, is that autistic women in some ways score more male-typical than non-autistic women, for instance in that they have more technical interests. This seems to be the main “correct prediction” the EQ-SQ theory has made in this study, but on net I would interpret these results as evidence against the theory.
Appendix: Item list
From Systemizing Quotient:
- If I were buying a computer, I would want to know exact details about its hard drive capacity and processor speed.If I were buying a car, I would want to obtain specific information about its engine capacity.I am fascinated by how machines work.I am not interested in understanding how wireless communication works (e.g. mobile phones).I find it difficult to understand instruction manuals for putting appliances together.When I look at a piece of furniture, I do not notice the details of how it was constructed.I am not very meticulous when I carry out D.I.Y or home improvements.When I look at a mountain, I think about how precisely it was formed.I do not tend to watch science documentaries on television or read articles about science and nature.When I am walking in the country, I am curious about how the various kinds of trees differ.When I read something, I always notice whether it is grammatically correct.If I had a collection (e.g. CDs, coins, stamps), it would be highly organised.Whenever I run out of something at home, I always add it to a shopping list.My clothes are not carefully organised into different types in my wardrobe.I am not interested in the details of exchange rates, interest rates, stocks and shares.I like to know how committees are structured in terms of who the different committee members represent or what their functions are.When I learn about historical events, I do not focus on exact dates.When an election is being held, I am not interested in the results for each constituency.When I look at a painting, I do not usually think about the technique involved in making it.When I listen to a piece of music, I always notice the way it's structured.I have a large collection e.g. of books, CDs, videos etc.I find myself categorising people into types (in my own mind).I am interested in my family tree and in understanding how everyone is related to each other in the family.I prefer social interactions that are structured around a clear activity, e.g. a hobby.I find it difficult to learn my way around a new city.When I learn about a new category I like to go into detail to understand the small differences between different members of that category.When I'm in a plane, I do not think about the aerodynamics.I am interested in knowing the path a river takes from its source to the sea.When travelling by train, I often wonder exactly how the rail networks are coordinated.When I hear the weather forecast, I am not very interested in the meteorological patterns.I enjoy looking through catalogues of products to see the details of each product and how it compares to others.When I learn a language, I become intrigued by its grammatical rules.
From Empathy Quotient:
- I am quick to spot when someone in a group is feeling awkward or uncomfortable.I can tune into how someone else feels rapidly and intuitively.Other people tell me I am good at understanding how they are feeling and what they are thinking.Friends usually talk to me about their problems as they say I am very understanding.I find it easy to put myself in somebody else’s shoes.It is hard for me to see why some things upset people so much.I find it hard to know what to do in a social situation.I don’t tend to find social situations confusing.Friendships and relationships are just too difficult, so I tend not to bother with them.
From Autism Spectrum Quotient:
- I often find it difficult to judge if something is rude or polite.I would rather go to a library than a party.I find it hard to make new friends.I find it difficult to work out people’s intentions.I enjoy social occasions.I find it easy to do more than one thing at once.I enjoy doing things spontaneously.New situations make me anxious.If there is an interruption, I can switch back to what I was doing very quickly.I frequently get so strongly absorbed in one thing that I lose sight of other things.I don’t know how to keep a conversation going.I know how to tell if someone listening to me is getting bored.I enjoy social chit-chat.I find it easy to ‘read between the lines’ when someone is talking to me.I find it easy to work out what someone is thinking or feeling just by looking at their face.When I talk, it isn’t always easy for others to get a word in edgeways.People often tell me that I keep going on and on about the same thing.I would rather go to the theatre than a museum.I like to collect information about categories of things (e.g. types of car, types of bird, types of train, types of plant etc).When I'm reading a story, I can easily imagine what the characters might look like.When I'm reading a story I find it difficult to work out the characters' intentions.I often notice small sounds when others do not.I usually notice car number plates or similar strings of information.I usually concentrate more on the whole picture, rather than the small details.
From Sensory Perception Quotient:
- I would be able to distinguish different people by their smell.I would be able to visually detect the change in brightness of a light each time a dimmer control moved one notch.I would notice if someone added 5 drops of lemon juice to my cup of water.I would be able to hear a leaf move if blown by the wind on a quiet street.I wouldn’t be able to feel the label at the back of my shirt even if I thought about it.
Additional items that I felt were nice/relevant to include, because in other surveys I've seen them be highly correlated with various relevant traits:
- I am very interested in technology.I am interested in carpentry.I love experiencing nature.I keep my home tidy.I am involved in politics.I visit art galleries.I am sociable.I enjoy helping people.I care about others' feelings.I take charge.I worry about things.I am not interested in theoretical discussions.
Appendix: Score distributions
- ^
People seem to assume that computing the group-separating axis yields the “essence” of the group in some sense, but that assumption is quite ill-defined and as far as I can tell usually not justified.
Discuss
