
Published on October 30, 2024 1:50 PM GMT
Cross-posted from my NAONotebook.
In April we released releaseda tool to modelthe efficacy of different approaches to stealth pathogenidentification. The tool's interface is pretty rough, which I'm notsuper happy about, but there just aren't that many people in the worldwho need to simulate the performance impact these design choices.
A month ago we published estimatesof RAi(1%) for influenza in municipal wastewater, and ended thatpost with:
In response to this work we plan to update our metagenomicbiosurveillance simulator in two ways:
We'll switch the simulator's RAi(1%) from using the mean of thedistribution to sampling from the full posterior distribution. Becauseour posteriors sometimes span several orders of magnitude, this changeshould better capture our uncertainty.
We'll replace our preliminary influenza A RAi(1%) point estimate of3.2e-8 with an option to choose each of the four above distributions,with medians of 1.4e-8, 1.4e-8, 2.8e-9, and 7.0e-10.
Overall we expect these changes to make our projections highervariance and somewhat less optimistic, but not to have a large impacton whether this approach to novel pathogen detection is practical.
With Dan's help I've now madeboth of these changes (#6,#7,#9),and additionally:
Stopped assuming uniform coverage along the genome, and insteaduse the distribution we've observed along SARS-CoV-2. (#5)While it would be better to generate estimates from a wider range ofpathogens, everything else we've looked at in our samples has too muchgenetic diversity for it to be easy to make these estimates. Now thatwe've done some spike-ins,however, I think it ought to be possible to use the highestconcentration spike-in sample to get second estimate, though I haven'ttried this. The overall effect of this change on our estimates shouldbe to increase variance while slightly lowering median performance.
Updated the pricing we see for the NovaSeq X 25B and switchedpricing to per-lane, based on the pricing we're seeing from sequencingproviders. (#10)It's great that sequencing is continuing to get cheaper!
Let's compare what the two simulators say for one weekly NovaSeq X 25B run,generating approximately 2e10 read pairs (SARS-CoV-2,Flu A)
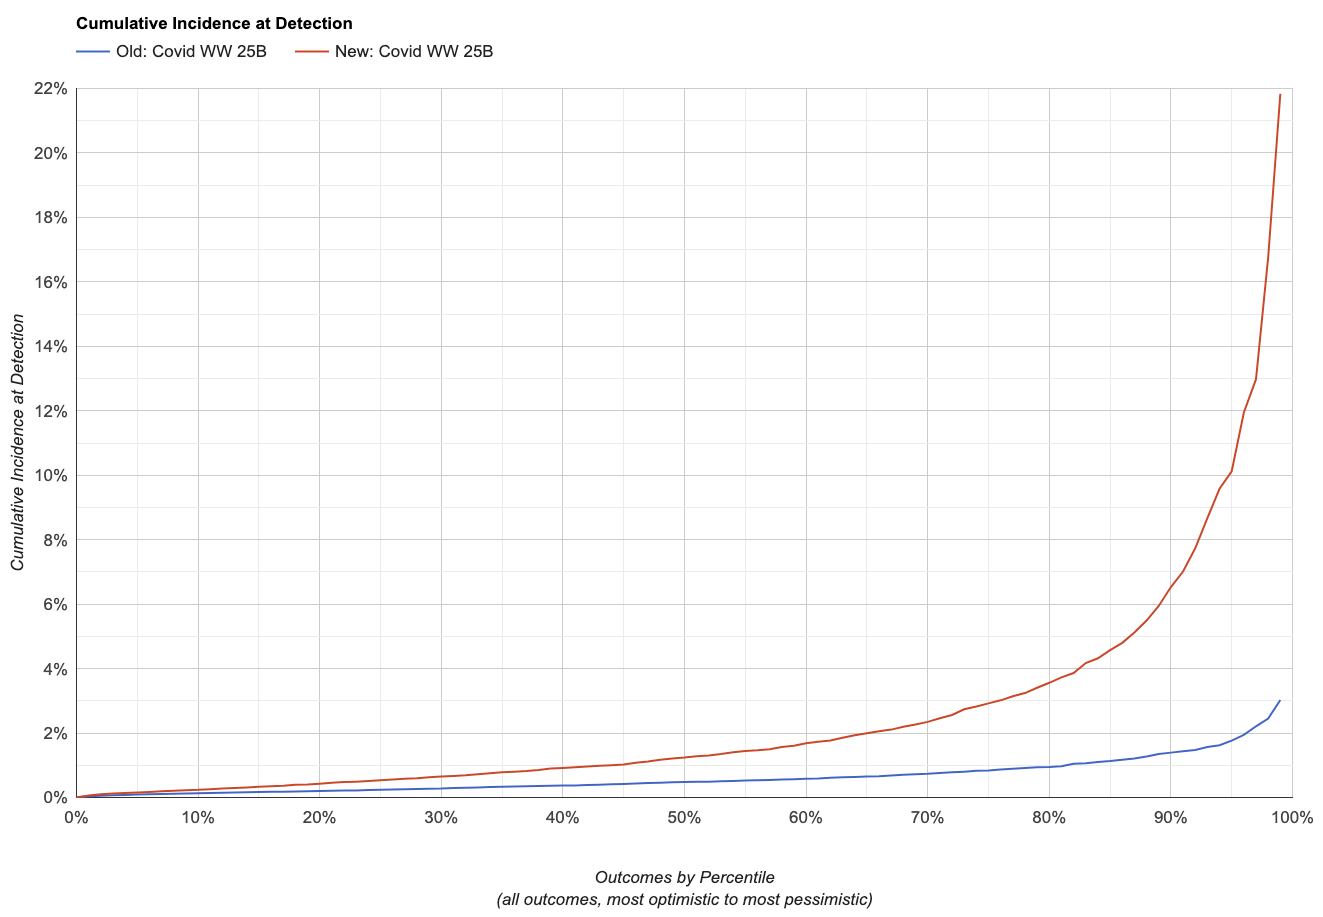
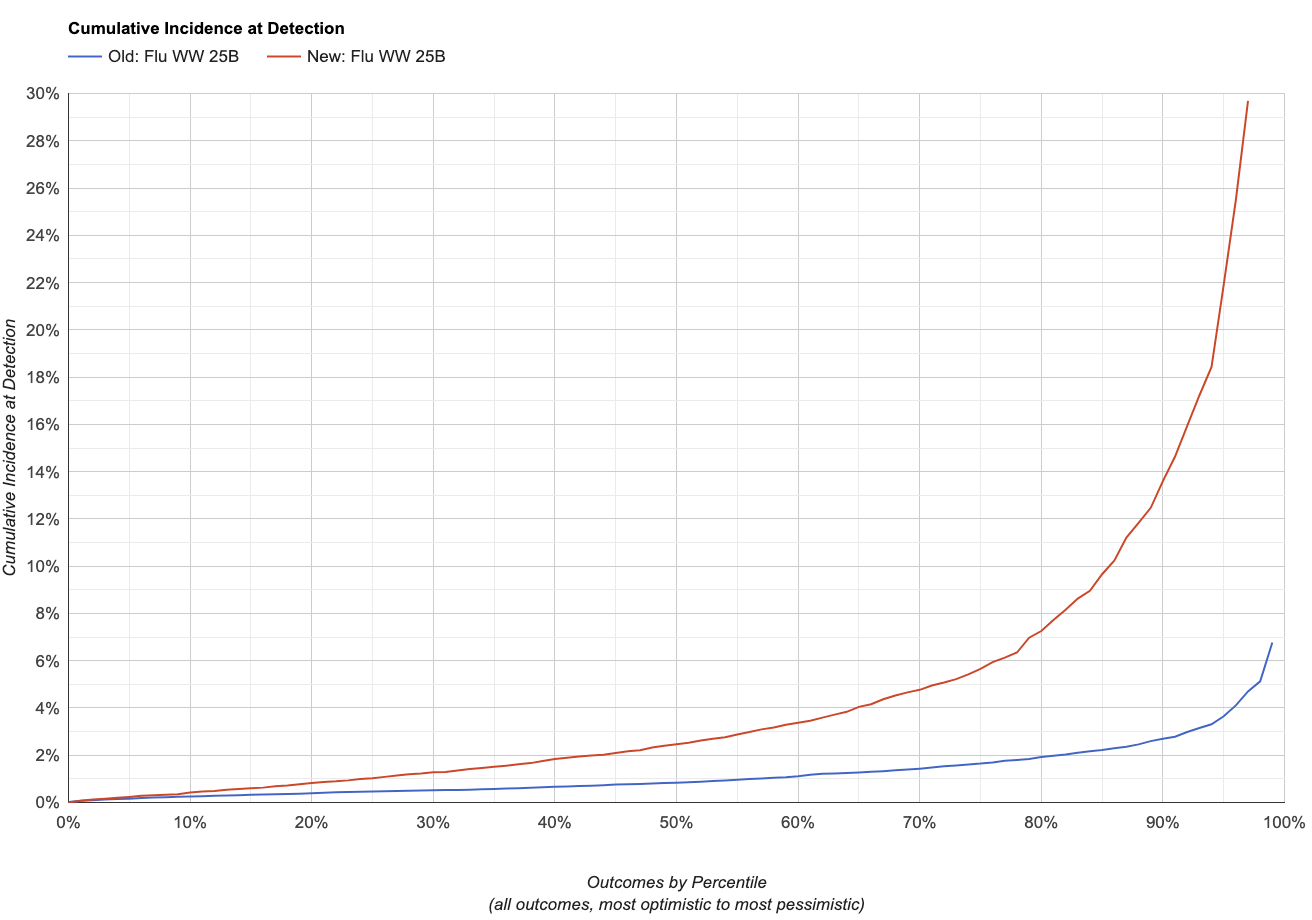
Note that lower is better here: the charts show the fraction of peoplein the monitored sewershed who have ever been infected by the time weraise the alarm.
| Scenario | Cumulative Incidence at Detection | ||||
|---|---|---|---|---|---|
| 25th | 50th | 75th | 90th | ||
| Old, SARS-CoV-2 | 0.24% | 0.48% | 0.84% | 1.40% | |
| New, SARS-CoV-2 | 0.53% | 1.20% | 2.90% | 6.50% | |
| Change in Sensitivity, SARS-CoV-2 | -55% | -60% | -71% | -78% | |
| Old, Flu A | 0.46% | 0.84% | 1.60% | 2.70% | |
| New, Flu A | 1.00% | 2.50% | 5.70% | 14.00% | |
| Change in Sensitivity, Flu A | -54% | -66% | -72% | -81% | |
This makes sense overall: the changes were expected to both make thesimulator less optimistic and increase the variance of itspredictions, and that's what we do see.
Comment via: facebook, lesswrong, mastodon
Discuss
