
Machine learning (ML) helps organizations to increase revenue, drive business growth, and reduce costs by optimizing core business functions such as supply and demand forecasting, customer churn prediction, credit risk scoring, pricing, predicting late shipments, and many others.
Conventional ML development cycles take weeks to many months and requires sparse data science understanding and ML development skills. Business analysts’ ideas to use ML models often sit in prolonged backlogs because of data engineering and data science team’s bandwidth and data preparation activities.
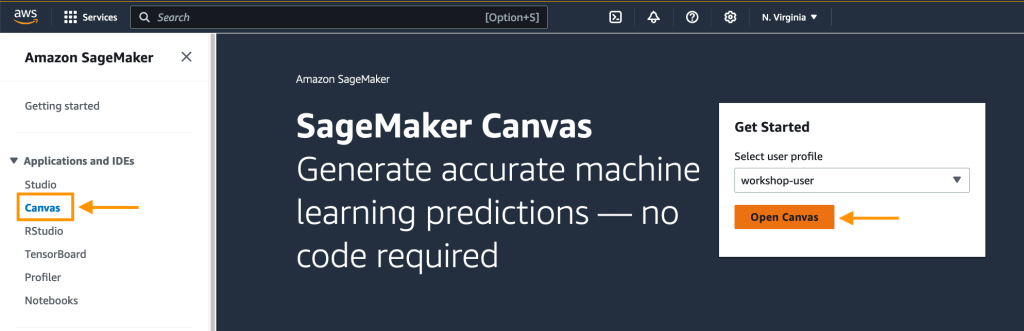
In this post, we dive into a business use case for a banking institution. We will show you how a financial or business analyst at a bank can easily predict if a customer’s loan will be fully paid, charged off, or current using a machine learning model that is best for the business problem at hand. The analyst can easily pull in the data they need, use natural language to clean up and fill any missing data, and finally build and deploy a machine learning model that can accurately predict the loan status as an output, all without needing to become a machine learning expert to do so. The analyst will also be able to quickly create a business intelligence (BI) dashboard using the results from the ML model within minutes of receiving the predictions. Let’s learn about the services we will use to make this happen.
Amazon SageMaker Canvas is a web-based visual interface for building, testing, and deploying machine learning workflows. It allows data scientists and machine learning engineers to interact with their data and models and to visualize and share their work with others with just a few clicks.
SageMaker Canvas has also integrated with Data Wrangler, which helps with creating data flows and preparing and analyzing your data. Built into Data Wrangler, is the Chat for data prep option, which allows you to use natural language to explore, visualize, and transform your data in a conversational interface.
Amazon Redshift is a fast, fully managed, petabyte-scale data warehouse service that makes it cost-effective to efficiently analyze all your data using your existing business intelligence tools.
Amazon QuickSight powers data-driven organizations with unified (BI) at hyperscale. With QuickSight, all users can meet varying analytic needs from the same source of truth through modern interactive dashboards, paginated reports, embedded analytics, and natural language queries.
Solution overview
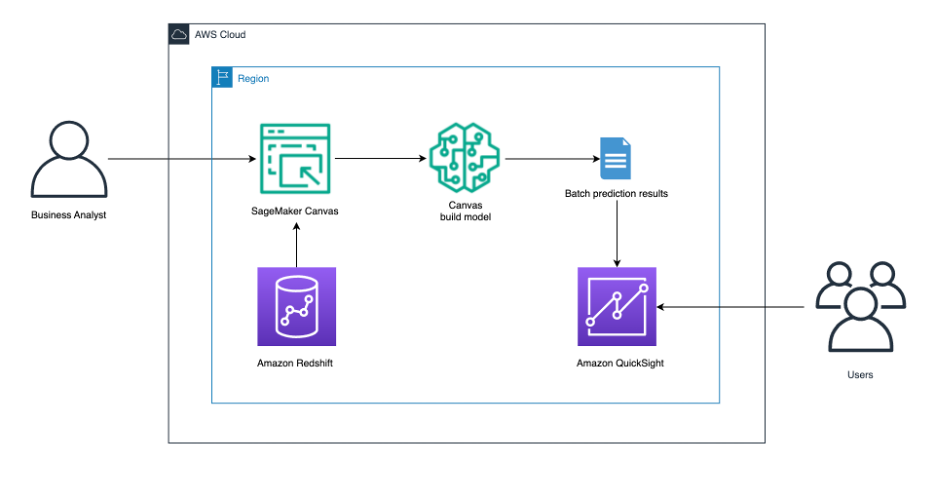
The solution architecture that follows illustrates:
- A business analyst signing in to SageMaker Canvas. The business analyst connects to the Amazon Redshift data warehouse and pulls the desired data into SageMaker Canvas to use. We tell SageMaker Canvas to build a predictive analysis ML model. After the model has been built, get batch prediction results. Send the results to QuickSight for users to further analyze.
Prerequisites
Before you begin, make sure you have the following prerequisites in place:
- An AWS account and role with the AWS Identity and Access Management (IAM) privileges to deploy the following resources:
- IAM roles. A provisioned or serverless Amazon Redshift data warehouse. For this post we’ll use a provisioned Amazon Redshift cluster. A SageMaker domain. A QuickSight account (optional).
Set up the Amazon Redshift cluster
We’ve created a CloudFormation template to set up the Amazon Redshift cluster.
- Deploy the Cloudformation template to your account.
 Enter a stack name, then choose Next twice and keep the rest of parameters as default. In the review page, scroll down to the Capabilities section, and select I acknowledge that AWS CloudFormation might create IAM resources. Choose Create stack.
 The stack will run for 10–15 minutes. After it’s finished, you can view the outputs of the parent and nested stacks as shown in the following figures:
Parent stack

Nested stack

Sample data
You will use a publicly available dataset that AWS hosts and maintains in our own S3 bucket as a workshop for bank customers and their loans that includes customer demographic data and loan terms.
Implementation steps
Load data to the Amazon Redshift cluster
- Connect to your Amazon Redshift cluster using Query Editor v2. To navigate to the Amazon Redshift Query v2 editor, please follow the steps Opening query editor v2. Create a table in your Amazon Redshift cluster using the following SQL command:

loan_cust table using the following COPY command: 

Set up chat for data
- To use the chat for data option in Sagemaker Canvas, you must enable it in Amazon Bedrock.
- Open the AWS Management Console, go to Amazon Bedrock, and choose Model access in the navigation pane.
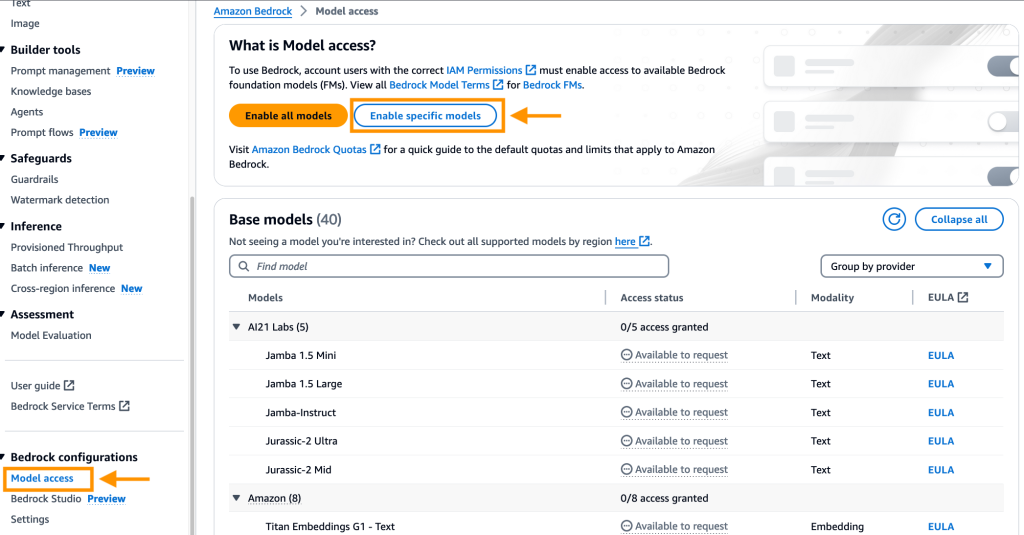 Choose Enable specific models, under Anthropic, select Claude and select Next.
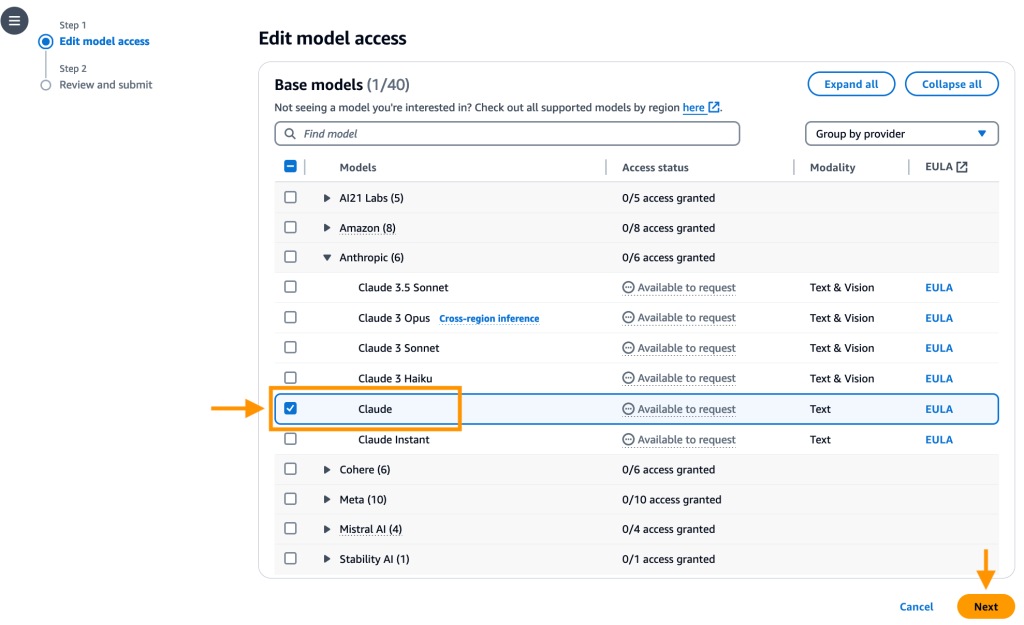 Review the selection and click Submit.
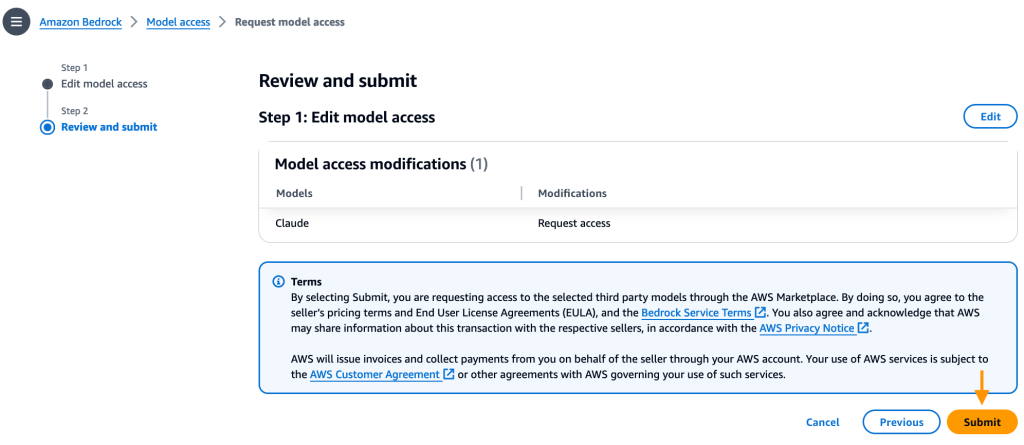
 Choose Datasets from the navigation pane, then choose the Import data dropdown, and select Tabular.
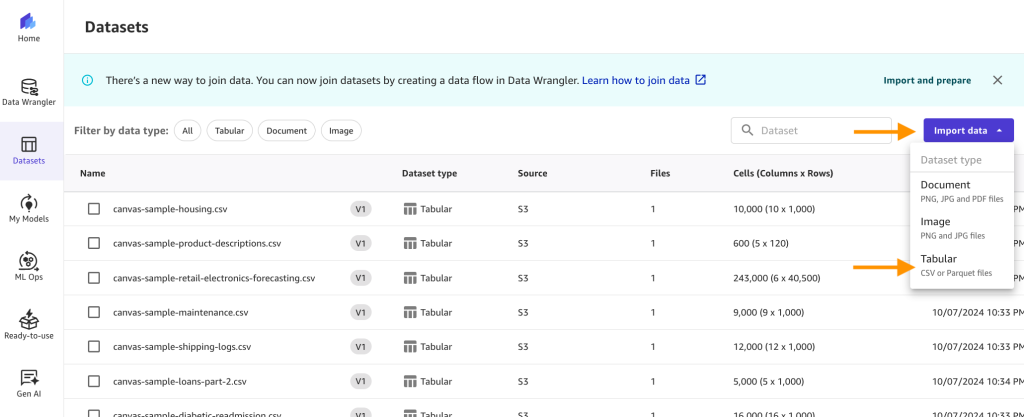
- For Dataset name, enter
redshift_loandata and choose Create.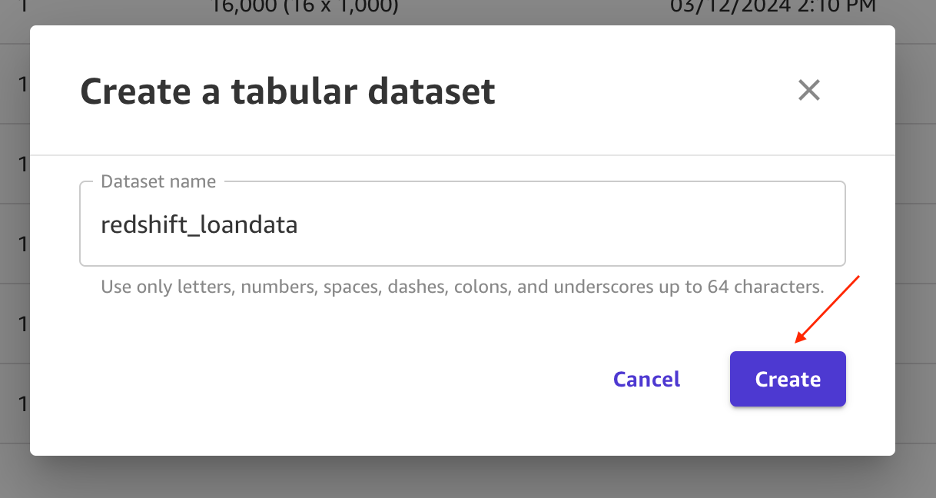 On the next page, choose Data Source and select Redshift as the source. Under Redshift, select + Add Connection.
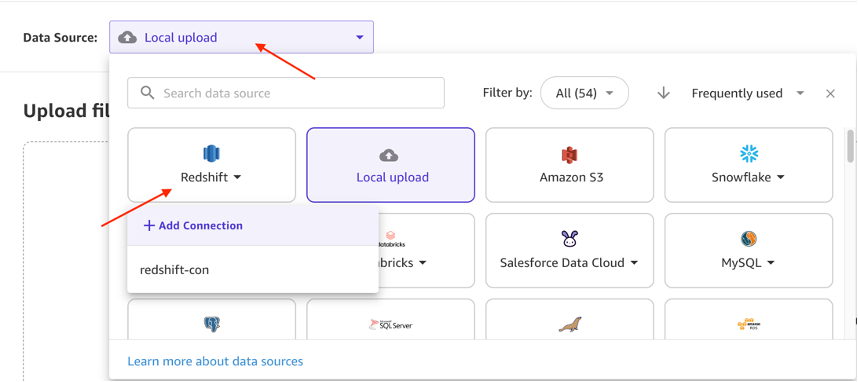 Enter the following details to establish your Amazon Redshift connection :
 - Cluster Identifier: Copy the
ProducerClusterName from the CloudFormation nested stack outputs. You can reference the preceding screen shot for Nested Stack, where you will find the cluster identifier output. Database name: Enter dev. Database user: Enter awsuser. Unload IAM Role ARN: Copy theRedshiftDataSharingRoleName from the nested stack outputs. Connection Name: Enter MyRedshiftCluster. Choose Add connection. 
public schema, drag the loan_cust table into the editor, and choose Create dataset.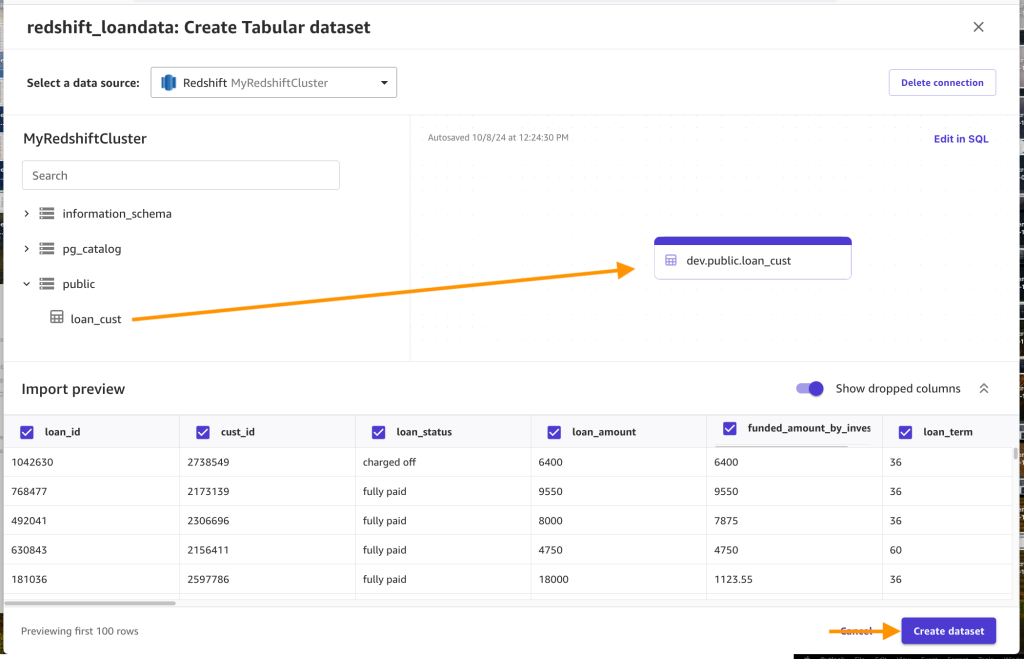 Choose the
 redshift_loandata dataset and choose Create a data flow.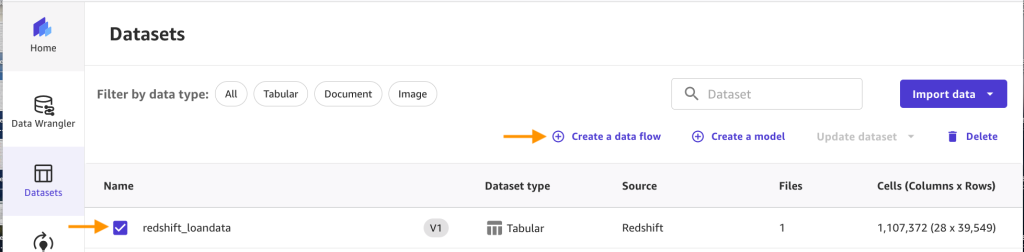 Enter
Enter redshift_flow for the name and choose Create.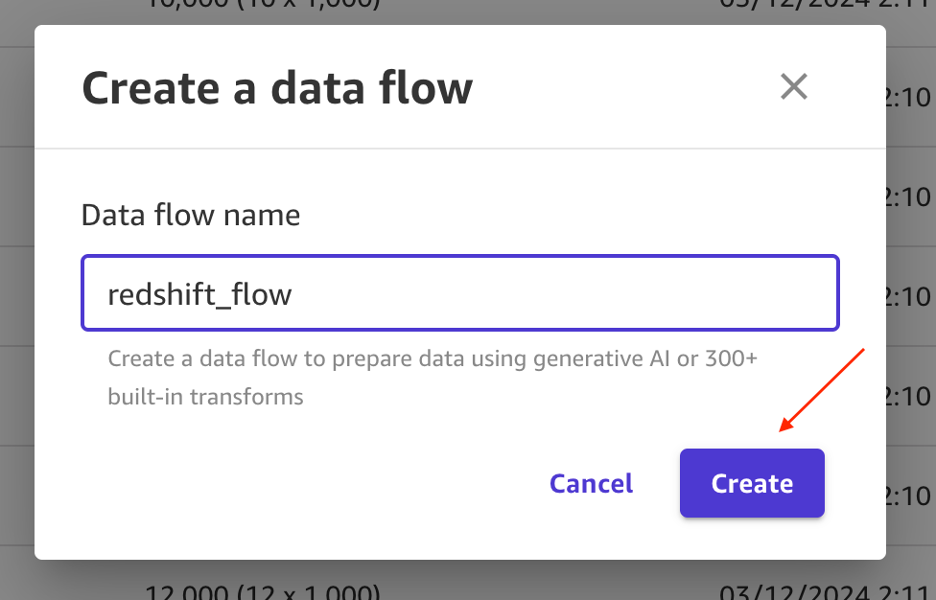 After the flow is created, choose Chat for data prep.
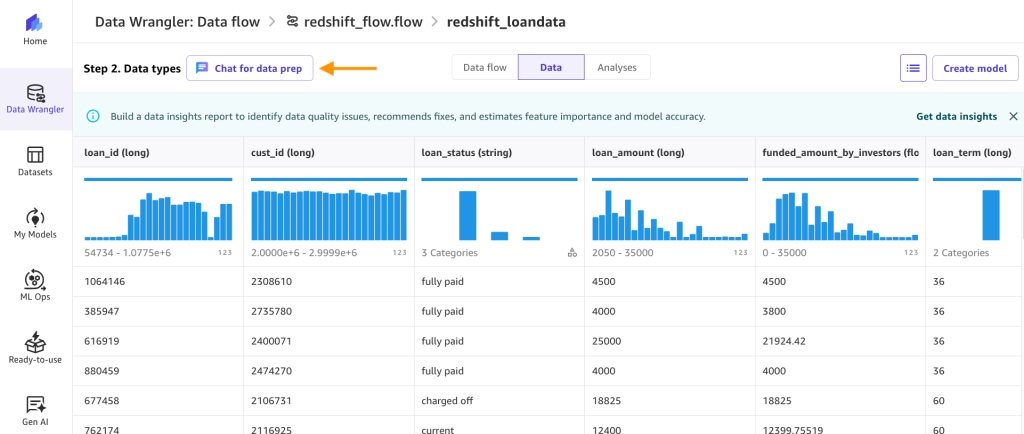 In the text box, enter
 summarize my data and choose the run arrow.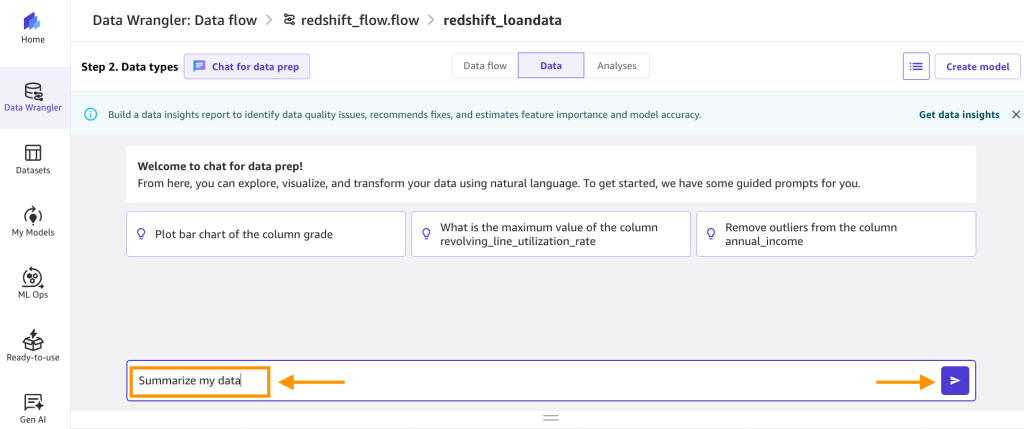 The output should look something like the following:
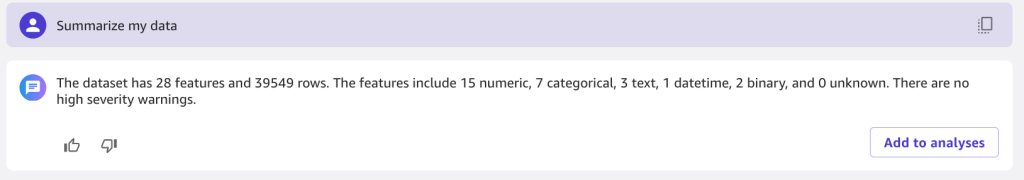
- Now you can use natural language to prep the dataset. Enter
Drop ssn and filter for ages over 17 and click on the run arrow. You will see it was able to handle both steps. You can also view the PySpark code that it ran. To add these steps as dataset transforms, choose Add to steps.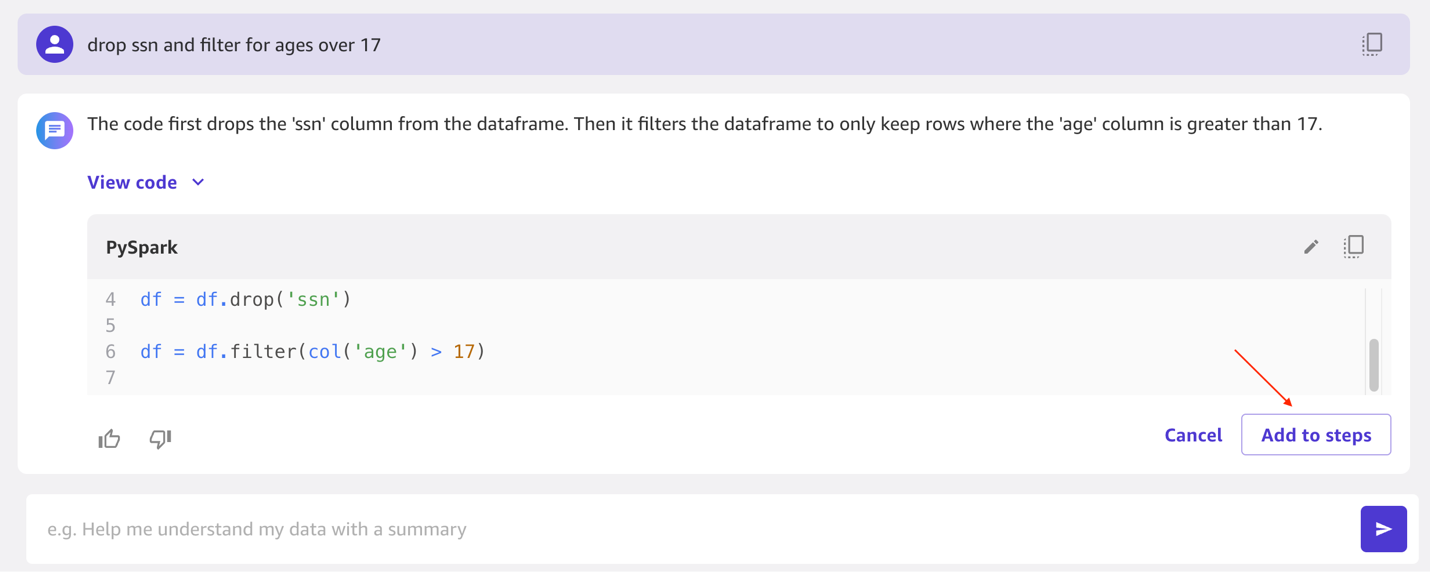 Rename the step to
 drop ssn and filter age > 17, choose Update, and then choose Create model.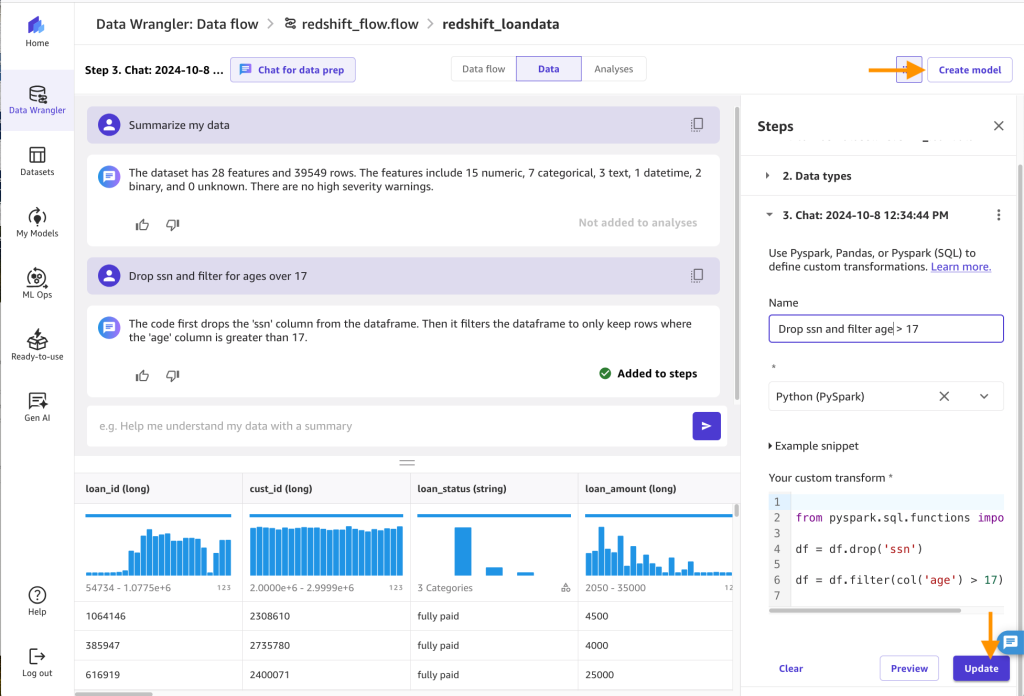 Export data and create model: Enter
 loan_data_forecast_dataset for the Dateset name, for Model name, enter loan_data_forecast, for Problem type, select Predictive analysis, for Target column, select loan_status, and click Export and create model.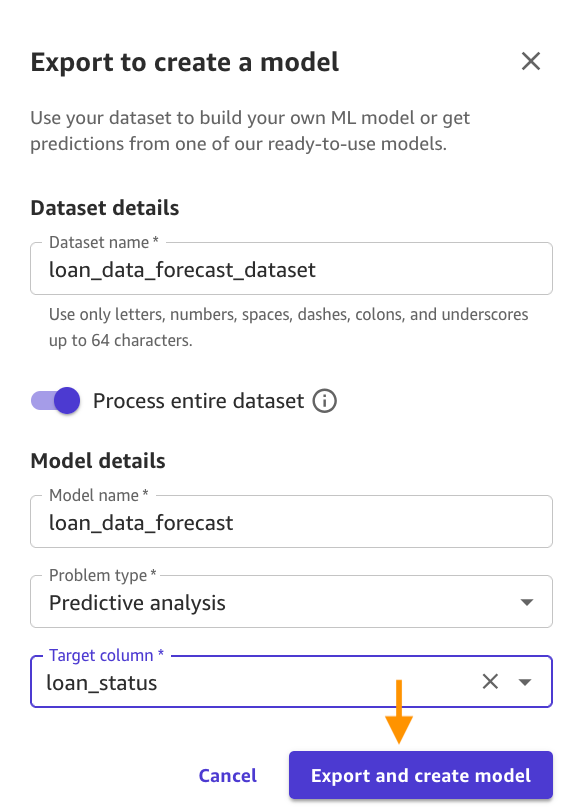 Verify the correct Target column and Model type is selected and click on Quick build.
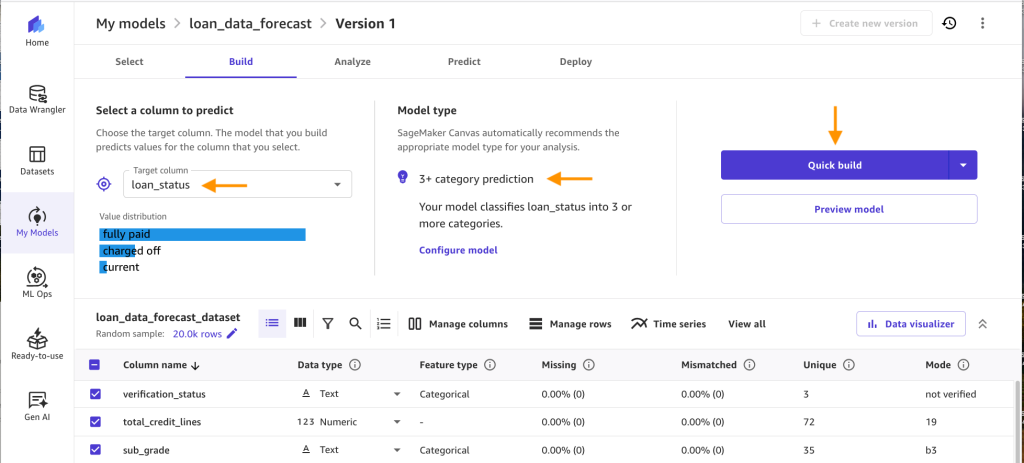 Now the model is being created. It usually takes 14–20 minutes depending on the size of your data set. After the model has completed training, you will be routed to the Analyze tab. There, you can see the average prediction accuracy and the column impact on prediction outcome. Note that your numbers might differ from the ones you see in the following figure, because of the stochastic nature of the ML process.
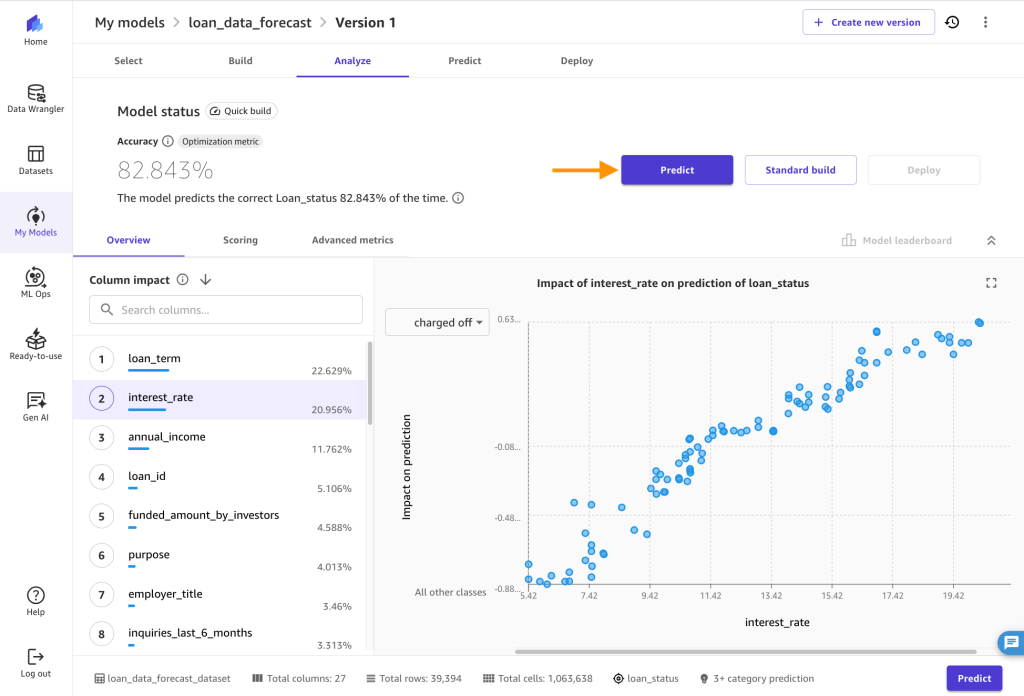
Use the model to make predictions
- Now let’s use the model to make predictions for the future status of loans. Choose Predict.
 Under Choose the prediction type, select Batch prediction, then select Manual.
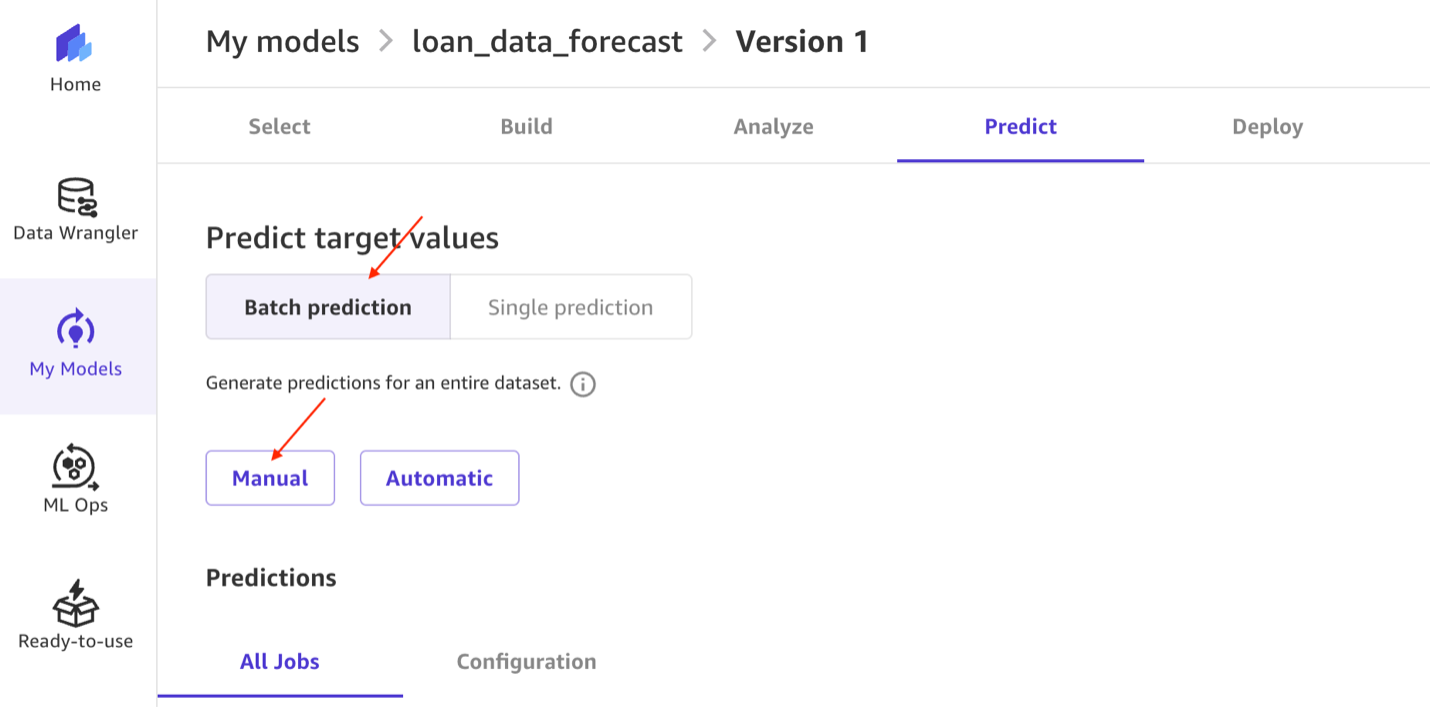 Then select loan_data_forecast_dataset from the dataset list, and click Generate predictions.
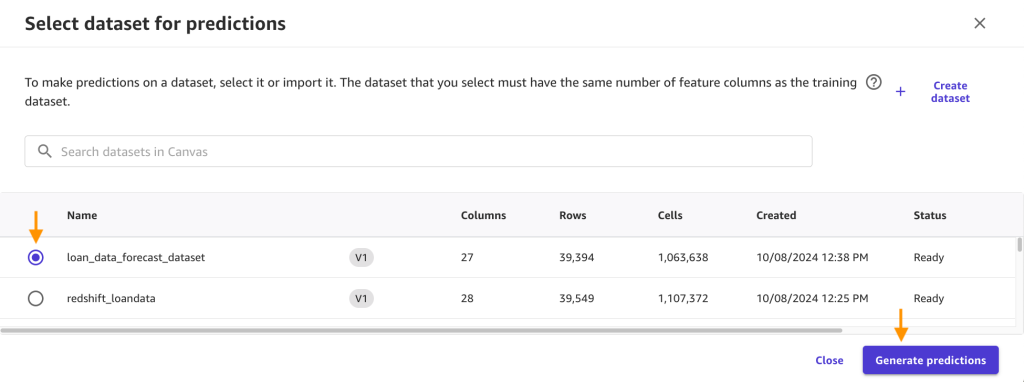 You’ll see the following after the batch prediction is complete. Click on the breadcrumb menu next to the Ready status and click on Preview to view the results.
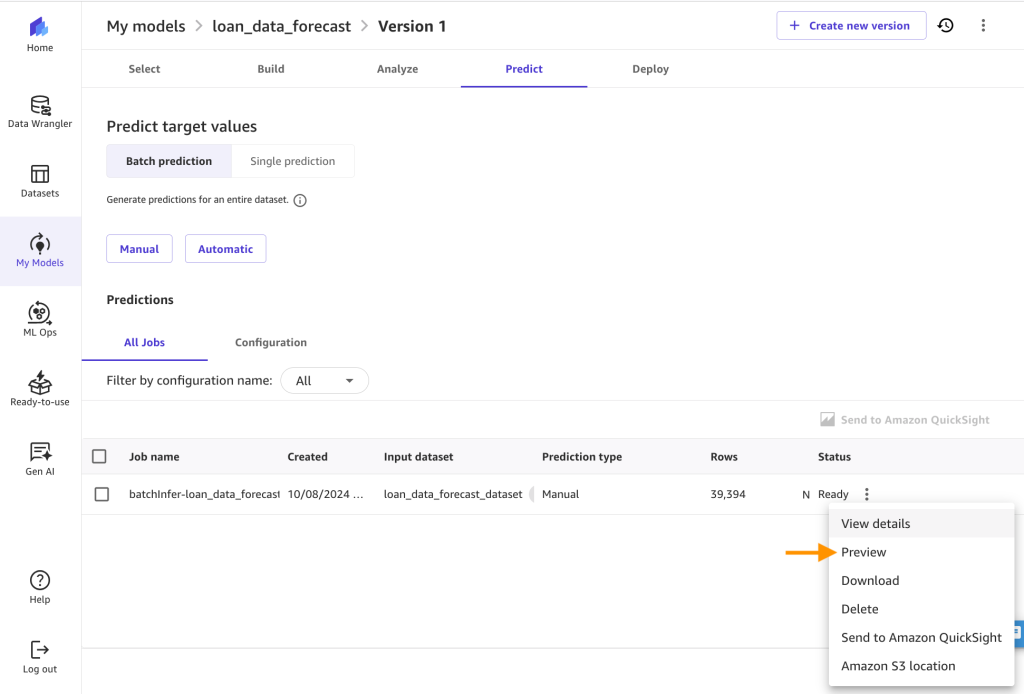 You can now view the predictions and download them as CSV.
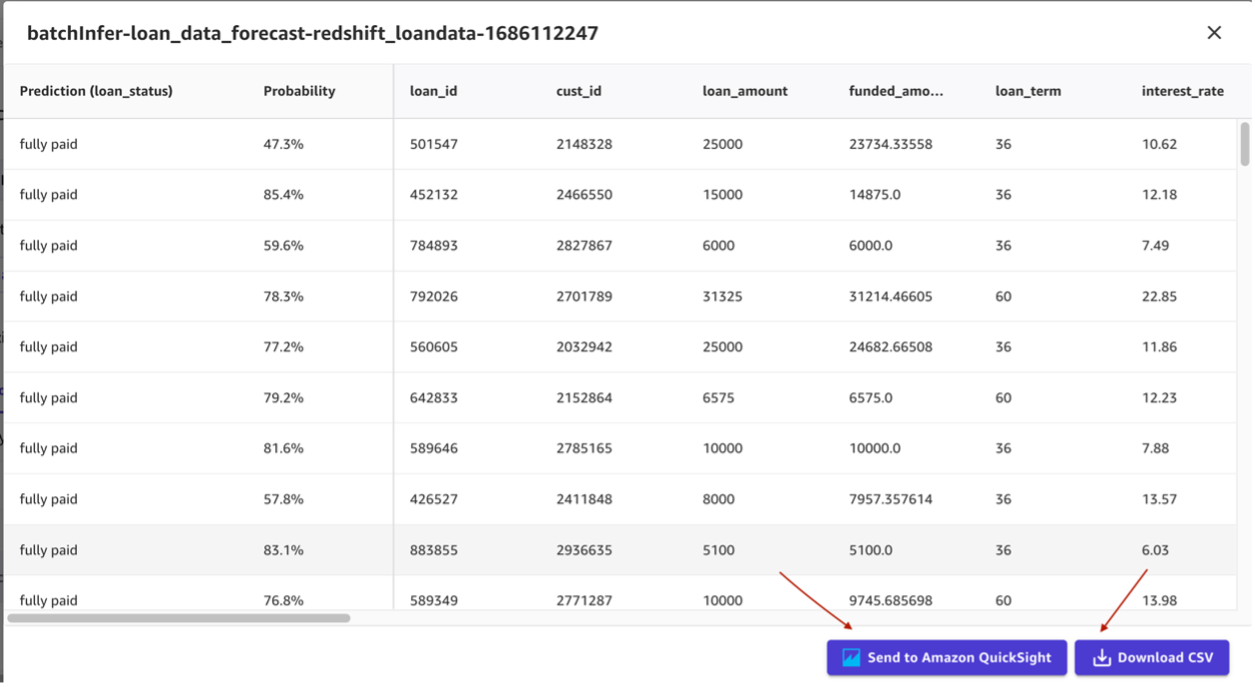 You can also generate single predictions for one row of data at a time. Under Choose the prediction type, select Single Prediction and then change the values for any of the input fields that you’d like, and choose Update.
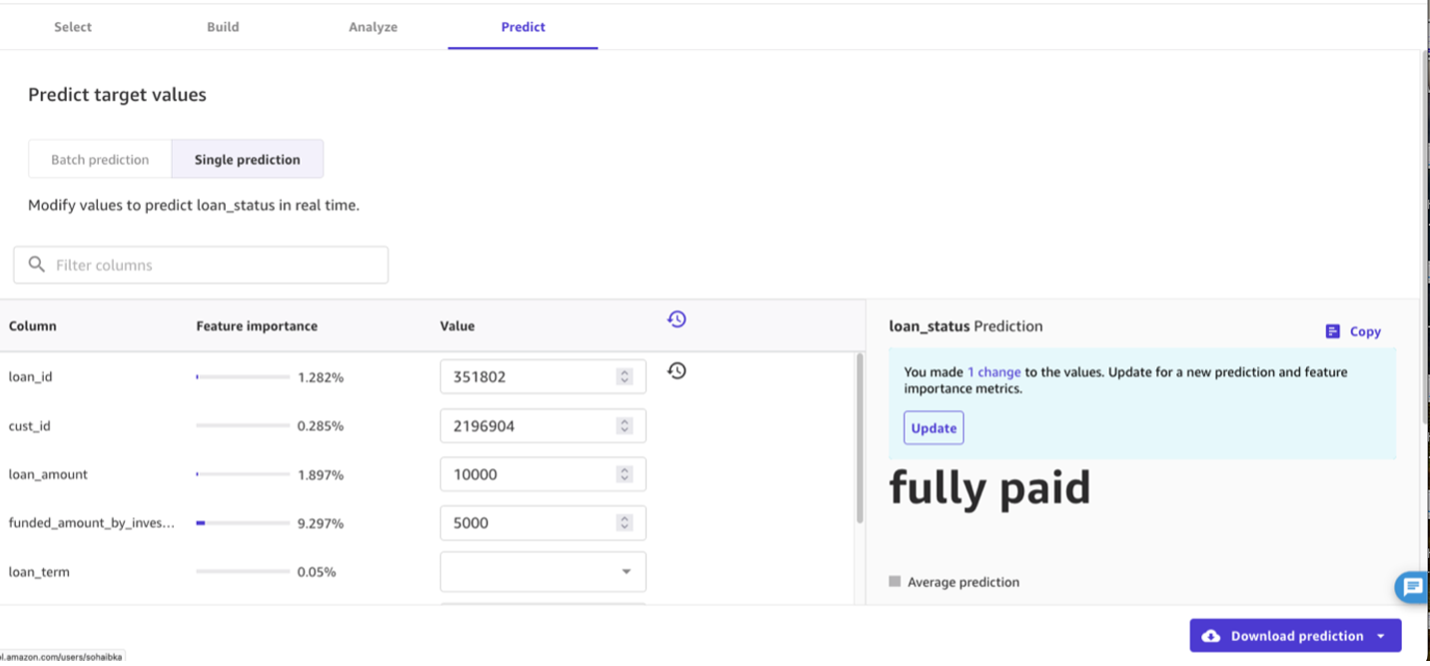
Analyze the predictions
We will now show you how to use Quicksight to visualize the predictions data from SageMaker canvas to further gain insights from your data. SageMaker Canvas has direct integration with QuickSight, which is a cloud-powered business analytics service that helps employees within an organization to build visualizations, perform ad-hoc analysis, and quickly get business insights from their data, anytime, on any device.
- With the preview page up, choose Send to Amazon QuickSight. Enter a QuickSight user name you want to share the results to.
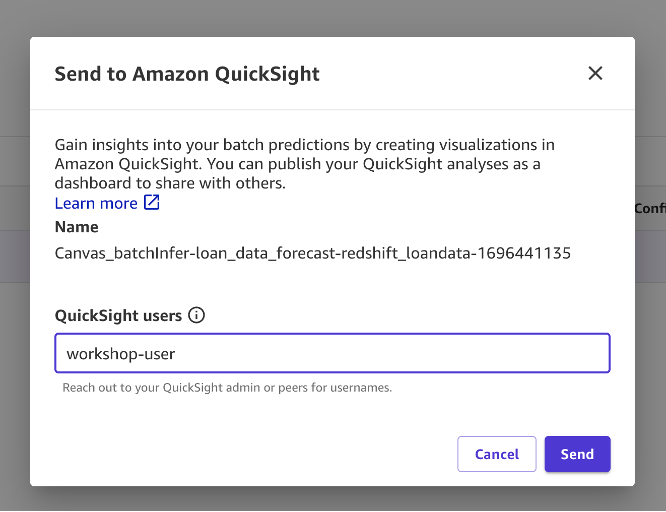 Choose Send and you should see confirmation saying the results were sent successfully.
 Now, you can create a QuickSight dashboard for predictions.
 - Go to the QuickSight console by entering QuickSight in your console services search bar and choose QuickSight.
 Under Datasets, select the SageMaker Canvas dataset that was just created. Choose Edit Dataset. Under the State field, change the data type to State.
 Choose Create with Interactive sheet selected.
 Under visual types, choose the Filled map Select the State and Probability Under Field wells, choose Probability and change the Aggregate to Average and Show as to Percent.
 Choose Filter and add a filter for loan_status to include fully paid loans only. Choose Apply.
 At the top right in the blue banner, choose Share and Publish Dashboard. We use the name Average probability for fully paid loan by state, but feel free to use your own. Choose Publish dashboard and you’re done. You would now be able to share this dashboard with your predictions to other analysts and consumers of this data.
 Clean up
Use the following steps to avoid any extra cost to your account:
- Sign out of SageMaker Canvas In the AWS console, delete the CloudFormation stack you launched earlier in the post.
Conclusion
We believe integrating your cloud data warehouse (Amazon Redshift) with SageMaker Canvas opens the door to producing many more robust ML solutions for your business at faster and without needing to move data and with no ML experience.
You now have business analysts producing valuable business insights, while letting data scientists and ML engineers help refine, tune, and extend models as needed. SageMaker Canvas integration with Amazon Redshift provides a unified environment for building and deploying machine learning models, allowing you to focus on creating value with your data rather than focusing on the technical details of building data pipelines or ML algorithms.
Additional reading:
- SageMaker Canvas Workshop re:Invent 2022 – SageMaker Canvas Hands-On Course for Business Analysts – Practical Decision Making using No-Code ML on AWS
About the Authors
 Suresh Patnam is Principal Sales Specialist AI/ML and Generative AI at AWS. He is passionate about helping businesses of all sizes transform into fast-moving digital organizations focusing on data, AI/ML, and generative AI.
 Sohaib Katariwala is a Sr. Specialist Solutions Architect at AWS focused on Amazon OpenSearch Service. His interests are in all things data and analytics. More specifically he loves to help customers use AI in their data strategy to solve modern day challenges.
 Michael Hamilton is an Analytics & AI Specialist Solutions Architect at AWS. He enjoys all things data related and helping customers solution for their complex use cases.
 Nabil Ezzarhouni is an AI/ML and Generative AI Solutions Architect at AWS. He is based in Austin, TX and passionate about Cloud, AI/ML technologies, and Product Management. When he is not working, he spends time with his family, looking for the best taco in Texas. Because…… why not?
